
TNS · Operational Performance & Energy Intelligence
Find the production loss and energy waste you cannot see
TNS pulls machine, production, and energy data into one operating picture: how productively each machine runs, where production time disappears, and how much energy goes into every unit of output.
The question it answersAre the machines running productively and efficiently?
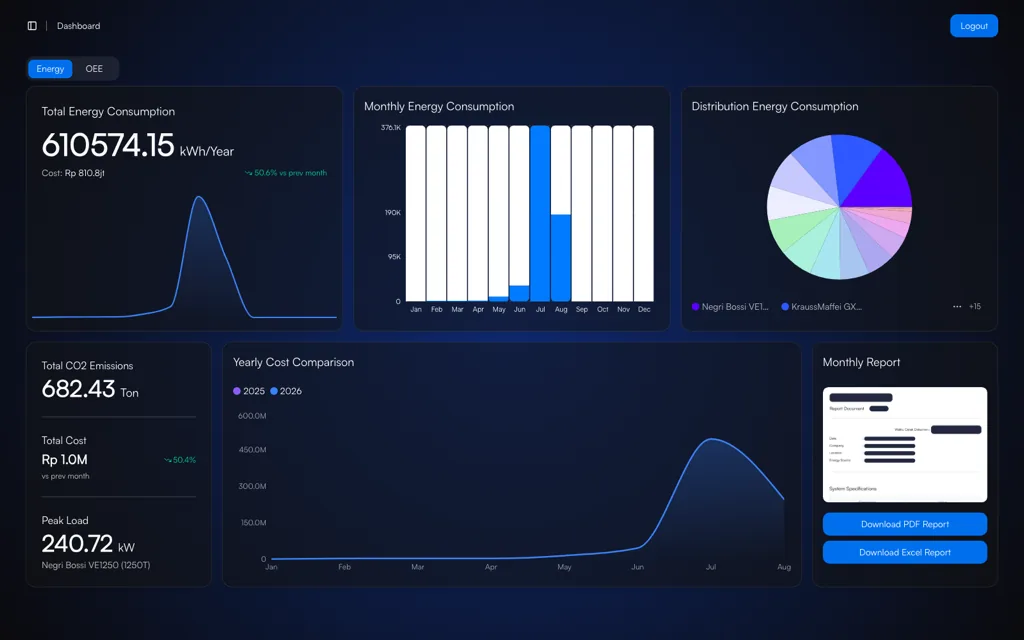
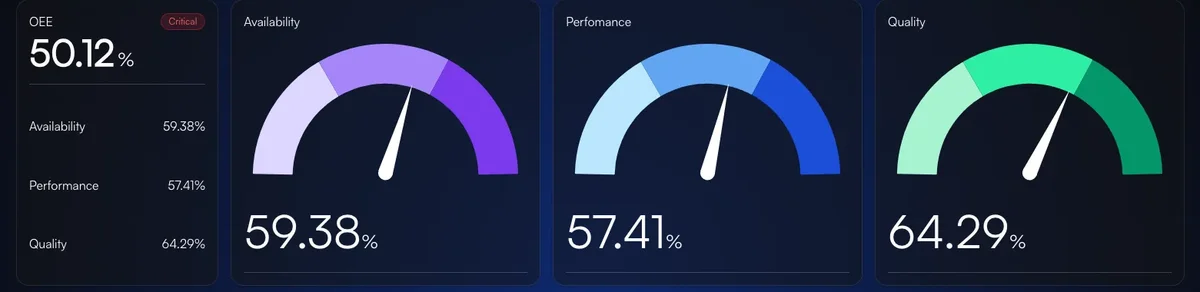
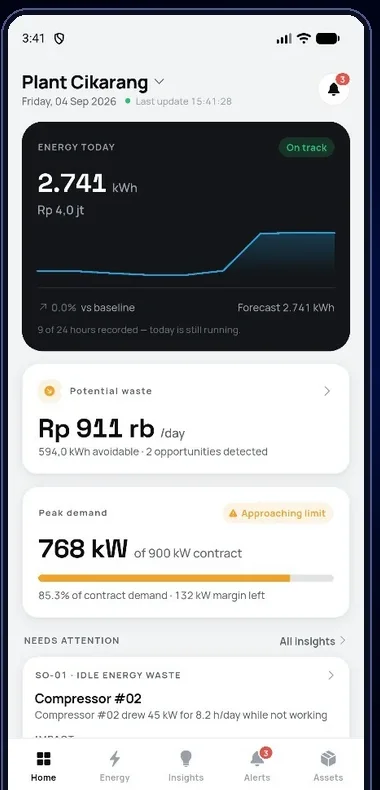
Captured from a running system, not an illustration.
Inside the platform
What is inside TNS
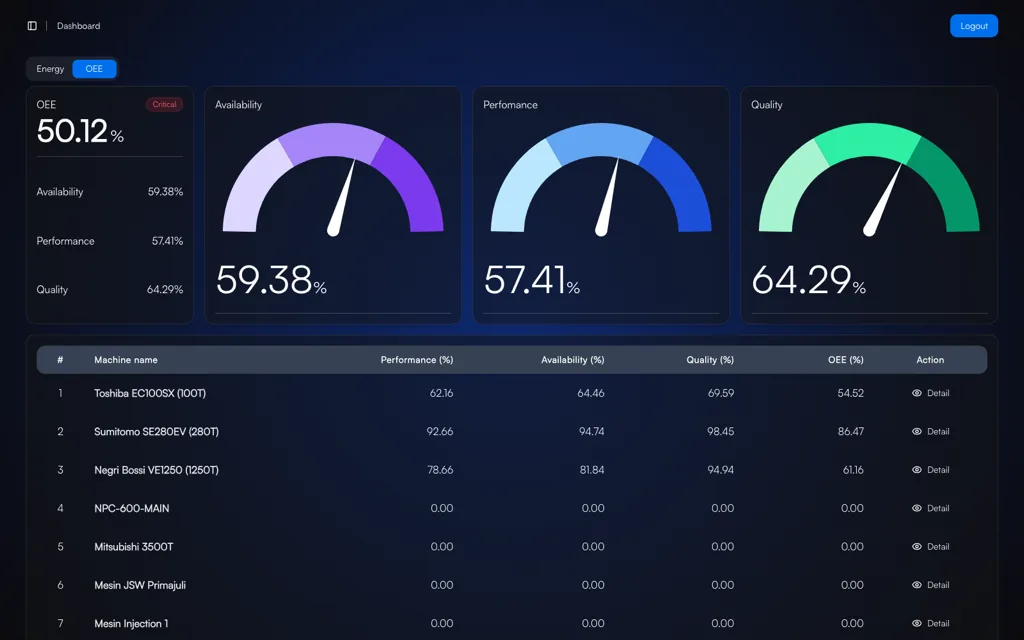
- Automatic OEE per machine and per shift
- Downtime detection with root-cause analysis
- Production monitoring and work order scheduling
- Energy monitoring per machine, including energy per unit of output
- Energy efficiency analysis with baseline verification
- 3D Digital Twin of the production floor
- Android & iOS app: energy findings with the calculation behind them, in your hand
Capabilities
Every capability can start on its own
You do not have to take on the whole platform first. Start with the most urgent need; the rest can follow.
EnergyEnergy MonitoringKnow what every machine draws, not just the total billLearn moreEnergyEnergy EfficiencyFind the waste, then prove the savingLearn moreEnergyTNS Energy MobileEnergy findings that reach the person who can act on themLearn moreProductivityOEE MonitoringMeasure machine effectiveness automatically, with no spreadsheet recapLearn moreProductivityDowntime MonitoringKnow when a machine stopped, for how long, and whyLearn moreProductivityProduction MonitoringTrack production output per machine and shift in real timeLearn moreOperations & VisualizationTNS Digital TwinSee your production floor as a 3D model connected to live dataLearn more
The system
Screens from a running installation
Book a TNS Assessment
We start from your plant as it is: the machines you run, the data that already exists, and which piece makes the most sense to do first.
- No obligation to buy
- A reply within business hours
- WhatsApp works too