
TNS · OEE MONITORING
Measure machine effectiveness automatically, with no spreadsheet recap
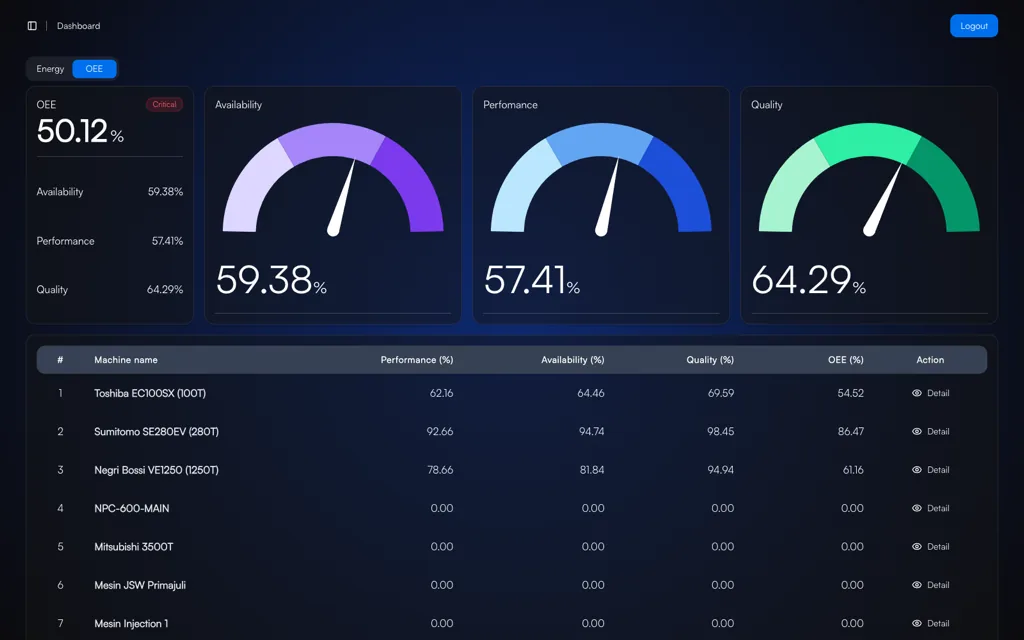
Availability, Performance, and Quality calculated from machine and production data, per shift and per machine, without the manual entry that always arrives late.
Platform: TNS · Productivity
The problem
OEE is worked out by hand, and the number is always late
When OEE depends on operator reports and an Excel recap, the number lands days after the event, already mixed with assumptions, and is hard to compare between shifts because everyone records it differently.
Signs we usually find
- OEE only exists monthly, too late to act on
- Downtime is defined differently between shifts or lines
- The Performance figure cannot be traced back to actual cycle time
- Rejects are recorded separately from machine data
Used by
- Production Manager
- Production Supervisor
- Continuous Improvement Engineer
- Plant Manager
Data it reads
- Machine state from PLC, sensor, or power signature
- Production counter or cycle signal
- Reject and scrap data
- Master data: standard cycle time, shift schedule, work orders
How it works
From the machine to a decision
01
Detect state
Running, idle, stopped
02
Compute the three
Availability, Performance, Quality
03
Aggregate
Per machine, shift, day
04
Compare
Across machines & against target
The system
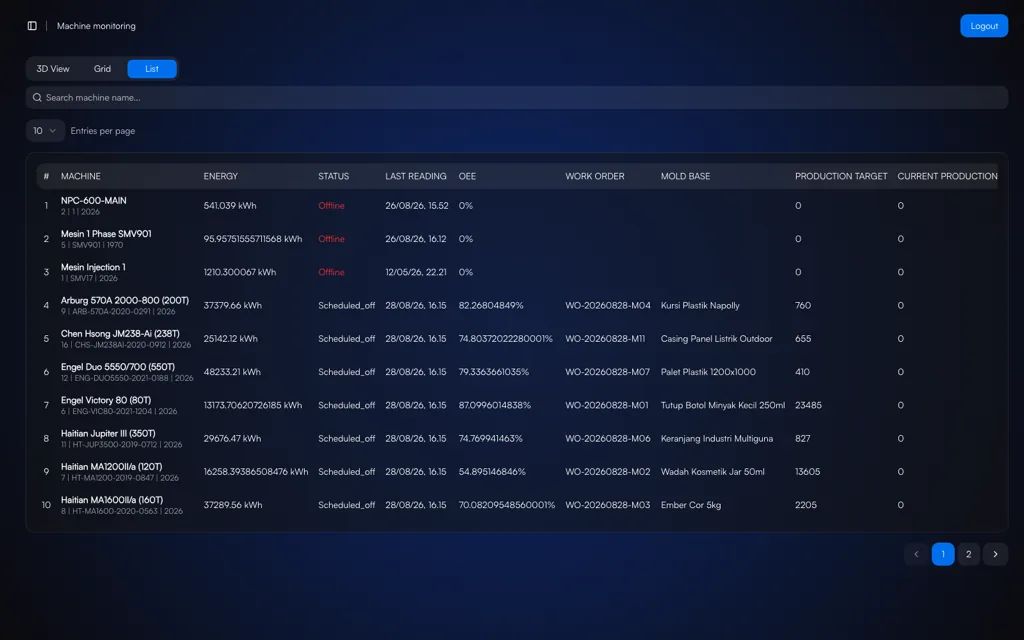
What it looks like on screen
Capabilities
What you can do with it
Automatic OEE
Calculated from machine data, not from a recap that turns up later.
Three factors, kept apart
Availability, Performance, and Quality each visible, so a drop has a cause.
Per machine & per shift
Shift comparisons run on one definition across every line.
Target vs actual
Machines under target are flagged without filtering a table by hand.
Historical trend
How OEE has moved over time, not just where it sits today.
Drill-down per machine
From the aggregate straight to the machine and period behind it.
Linked to downtime
A drop in Availability traces back to specific downtime events.
Linked to energy
OEE and energy use read off the same machine over the same period.
On the floor
How it is used day to day
01
OEE drops
Visible on the dashboard
02
Which factor?
A, P, or Q
03
Which machine & shift?
Drill down
04
Act
Downtime, settings, or quality
Impact
Why it matters
01
Production loss becomes visible and countable
The gap between installed capacity and actual output stops being an estimate. It breaks into three factors, each with a different owner.
02
Production meetings run on one set of numbers
Production, maintenance, and quality read a single source, so the discussion moves from arguing about figures to deciding what to do.
03
Better capacity investment decisions
Before buying a new machine, you can see how much capacity is still recoverable from the ones you have.
Start with this alone
OEE Monitoring can start on a single pilot line. Downtime, production, and energy monitoring share the same machine and shift structure, so adding them later needs no reconfiguration.
In practice
Across different kinds of plants
- Injection Moulding
- Track OEE across machines with different cycle times without flattening the targets.
- Automotive
- Compare day and night shift performance on the same line.
- Food & Beverage
- Separate changeover loss from loss caused by machine trouble.
- Multi-plant
- Align the OEE definition across plants so the comparison means something.
Integration
It connects to what you already have
No PLC, meter, or ERP needs replacing. Machvory reads from the equipment already installed in your plant.
01
PLCs, sensors, meters
Data at the machine
02
Edge gateway
Acquisition and buffering
03
Machvory integration layer
Modbus, OPC UA, MQTT
04
TNS / OPTIMUS
Analytics and workflow
05
ERP, SAP, BI
Enterprise reporting
- Siemens, Mitsubishi, Omron, Allen-Bradley PLCs
- Modbus TCP and Modbus RTU
- OPC UA
- MQTT
- Power and energy meters
- Vibration, temperature, current sensors
- Existing SCADA and HMI
- ERP and SAP
- REST API and SQL
Next steps
What usually comes next
Start with one need and add the rest when you actually need it.
FAQ
Questions we get a lot
What about older machines with no digital output?
Machine state and cycle can be reconstructed from added sensors such as a proximity switch, a current transformer, or the andon light signal. The approach is chosen machine by machine based on what is actually there.
Do operators still have to enter anything?
State detection and the calculation run on their own. Operator input still earns its place for what a machine cannot report, such as the reason for a stop or the reject category, which makes root-cause analysis sharper.
Do we have to replace our existing PLCs or machines?
No. Machvory reads from what is already installed over Modbus, OPC UA, MQTT, or a power meter. Where a machine does not expose the data point we need, we add a sensor or gateway to that machine alone rather than touching its controls.
Can it run on-premise, with no cloud?
Yes. It can run entirely on a server inside the plant, in the cloud, or split between the two. The choice usually comes down to your IT/OT policy and what the plant network can carry.
How long does the first implementation take?
It depends on how ready the data points are and how many machines are involved. We normally start with a pilot on one line or a few critical assets to prove out data quality and the workflow, then widen once it holds up on the floor.
See How OEE Gets Measured Automatically
Our engineers look at your machines and the data you already have, then scope a pilot that is realistic to run.
- No obligation to buy
- A reply within business hours
- WhatsApp works too