
OPTIMUS · MAINTENANCE ANALYTICS
Measure maintenance performance with numbers, not impressions
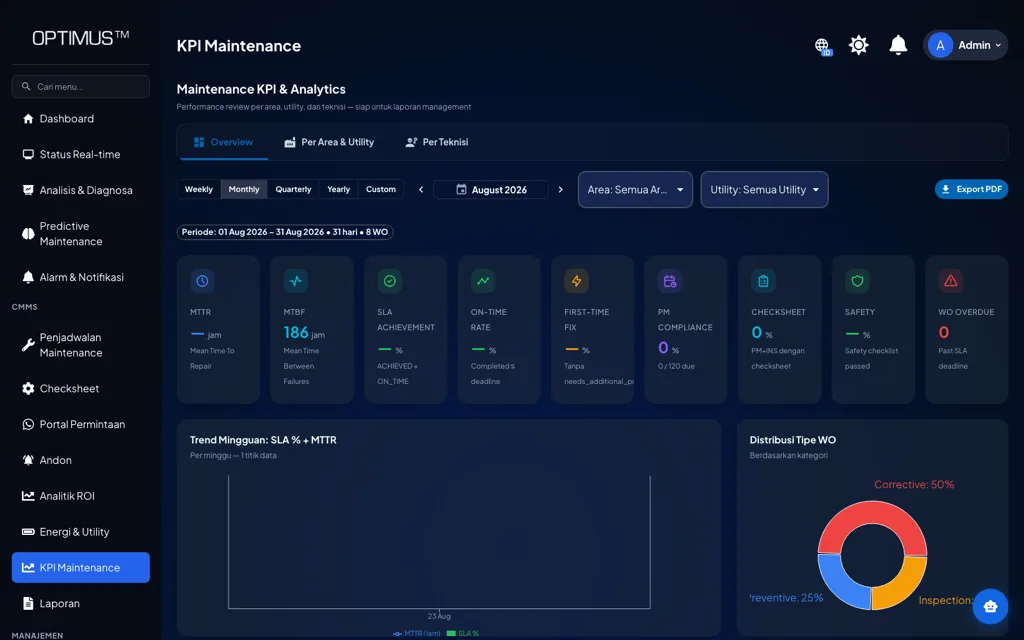
Maintenance KPIs, work order performance, preventive maintenance compliance, and repeat failures calculated from the work actually recorded in the system.
Platform: OPTIMUS · Maintenance
The problem
Maintenance performance is hard to prove
When work is not recorded consistently, there is nothing to go on when asked whether the maintenance team is getting better or worse. Budget discussions end up running without numbers to back them.
Signs we usually find
- No maintenance KPIs are calculated on a regular basis
- Preventive maintenance compliance is not measured
- Repeat failures are never picked up as a pattern
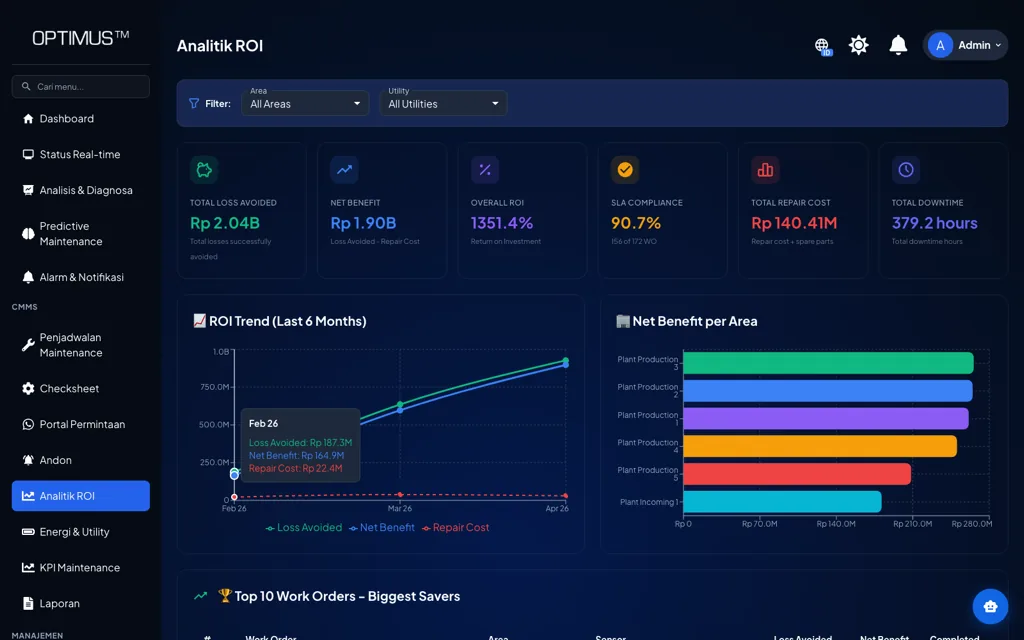
- The cost impact of maintenance work is not visible
Used by
- Maintenance Manager
- Reliability Engineer
- Plant Manager
- Finance / Cost Control
Data it reads
- Work orders with start time, finish time, and assignment
- Asset failure and downtime history
- Preventive maintenance plan
- Cost parameters for the economic impact analysis
How it works
From the machine to a decision
01
Work recorded
From the CMMS
02
Aggregate
Per asset, area, period
03
KPIs
Performance & compliance
04
Review
Improvement priorities
The system
What it looks like on screen
Capabilities
What you can do with it
Maintenance KPIs
Performance indicators calculated automatically from recorded work.
Work order performance
Completion time and backlog visible period by period.
Preventive compliance
Planned work against completed work, compared as a number.
Repeat failures
Assets that keep having the same problem get flagged.
Maintenance downtime
Stop time tied to maintenance work is measured.
Economic impact analysis
Cost parameters used to assess the financial impact of maintenance work.
Comparison across areas
Performance across areas or plants compared on the same definitions.
Periodic reports
Summaries you can export for meetings and management reporting.
On the floor
How it is used day to day
01
Work
Recorded in the CMMS
02
KPIs
Calculated automatically
03
Findings
Patterns & deviations
04
Improve
Process adjusted
Impact
Why it matters
01
Maintenance budget discussions backed by data
A request for more resources or a change in strategy is backed by numbers from work that actually happened.
02
Chronic problem assets identified
Assets that need the same repair again and again become candidates for a design fix or replacement.
03
Team performance that is measurable and fair
Reviews based on work data leave less room for judgment that rests on perception.
Start with this alone
Maintenance Analytics reads its data from the CMMS, so it is usually switched on once work orders have been recorded consistently for at least a few periods.
In practice
Across different kinds of plants
- Manufacturing
- Review preventive maintenance compliance across production areas.
- Utility
- Trace the utility equipment that gets repaired most often.
- Multi-site
- Compare maintenance performance across sites using the same indicators.
- Management
- Put together the monthly maintenance performance report without a manual recap.
Integration
It connects to what you already have
No PLC, meter, or ERP needs replacing. Machvory reads from the equipment already installed in your plant.
01
PLCs, sensors, meters
Data at the machine
02
Edge gateway
Acquisition and buffering
03
Machvory integration layer
Modbus, OPC UA, MQTT
04
TNS / OPTIMUS
Analytics and workflow
05
ERP, SAP, BI
Enterprise reporting
- Siemens, Mitsubishi, Omron, Allen-Bradley PLCs
- Modbus TCP and Modbus RTU
- OPC UA
- MQTT
- Power and energy meters
- Vibration, temperature, current sensors
- Existing SCADA and HMI
- ERP and SAP
- REST API and SQL
Next steps
What usually comes next
Start with one need and add the rest when you actually need it.
FAQ
Questions we get a lot
Can we use it if our past records are messy?
Analytics are only as good as the data underneath them. That is why implementation usually starts by standardizing work order records through the CMMS, so the KPIs that come after can be trusted.
Can the indicators be customized?
Period definitions, asset grouping, and cost parameters can be adjusted to match how your company measures maintenance performance.
Do we have to replace our existing PLCs or machines?
No. Machvory reads from what is already installed over Modbus, OPC UA, MQTT, or a power meter. Where a machine does not expose the data point we need, we add a sensor or gateway to that machine alone rather than touching its controls.
Can it run on-premise, with no cloud?
Yes. It can run entirely on a server inside the plant, in the cloud, or split between the two. The choice usually comes down to your IT/OT policy and what the plant network can carry.
How long does the first implementation take?
It depends on how ready the data points are and how many machines are involved. We normally start with a pilot on one line or a few critical assets to prove out data quality and the workflow, then widen once it holds up on the floor.
Further reading
- Maintenance KPIs: the indicators, the formulas, and how to use them
- Maintenance work orders: what they are, what goes on the form, and the workflow
- Root cause analysis (RCA) in maintenance: 5 Whys, fishbone, and how to run one
- How to calculate MTBF and MTTR, and how to read them correctly
- What is preventive maintenance? Types, scheduling, and limits
- What is a CMMS? Definition, functions, and how to implement one in a plant
See Your Maintenance KPIs
Our engineers look at your machines and the data you already have, then scope a pilot that is realistic to run.
- No obligation to buy
- A reply within business hours
- WhatsApp works too