
TNS · PRODUCTION MONITORING
Track production output per machine and shift in real time
Target, actual, work order progress, and machine state are read from the same source, so you know where production stands while it runs, not after the shift ends.
Platform: TNS · Productivity
The problem
You find out where production stands when it is too late
If progress is only reported at the end of the shift, a delay can no longer be corrected. What a supervisor needs is the current position against target, per machine, while the shift is still running.
Signs we usually find
- Work order progress is reported by hand, and not consistently
- The gap between target and actual only shows up at the end of the shift
- The production schedule lives apart from machine data
- It is hard to tell which machine is holding up an order
Used by
- Production Planner (PPIC)
- Production Supervisor
- Plant Manager
- Delivery / Customer Service team
Data it reads
- Production counter or cycle signal per machine
- Work orders and the production schedule
- Master data for products, molds, and standard cycle time
How it works
From the machine to a decision
01
Schedule
Work orders per machine & date
02
Execute
Output read automatically
03
Progress
Actual vs target as it runs
04
Follow up
At-risk orders flagged
The system
What it looks like on screen
Capabilities
What you can do with it
Target vs actual
The gap to target is visible while the shift is running.
Progress per work order
Quantity produced against the order quantity is read automatically.
Production schedule
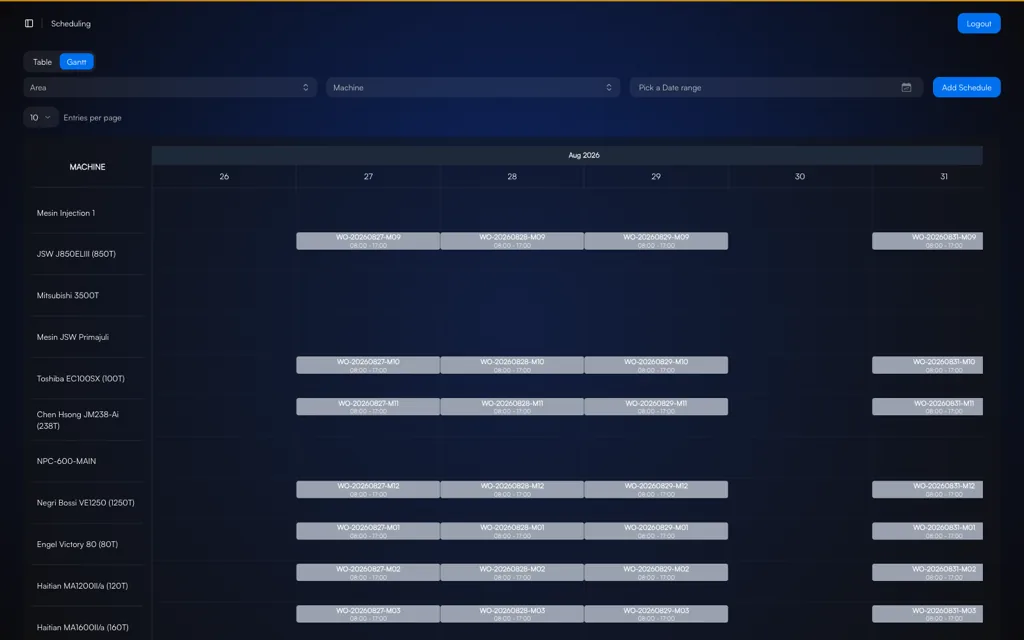
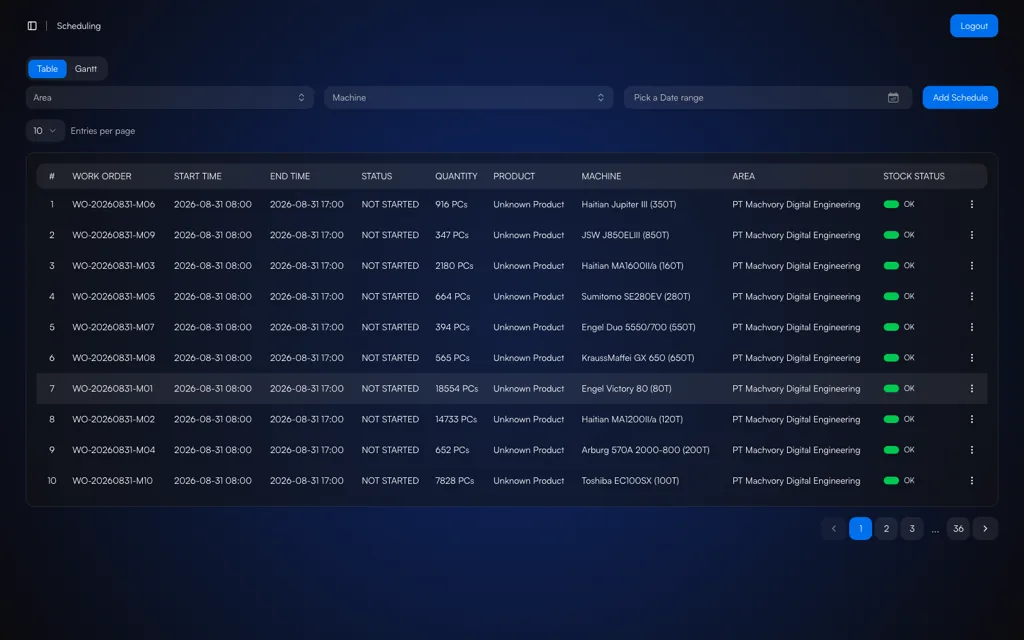
The plan per machine per day, shown as a table and as a Gantt view.
Real-time machine state
Running, standby, offline, and scheduled off kept apart.
Output per shift
Production split by shift with no manual recap.
Reject logging
Rejects are recorded and feed the Quality factor in OEE.
Multi-machine & multi-area
Production load across machines and areas in a single view.
Linked to OEE
The same output data is used to calculate Performance and Quality.
On the floor
How it is used day to day
01
Order scheduled
Machine & time
02
Production runs
Output read
03
Progress tracked
Real time
04
Order complete
Actual recorded
Impact
Why it matters
01
There is still time to correct
When a delay shows up mid-shift, adding resources or changing the sequence can still save the delivery commitment.
02
Planning based on real capacity
Actual data per machine gives PPIC a picture of the capacity that is really available, not the capacity on paper.
03
One data source for production and maintenance
Output, downtime, and energy are read off the same machine, so the effect of a disruption on delivery can be explained.
Start with this alone
Production Monitoring can go in first on the line with the tightest delivery commitments, then extend to OEE, downtime, and energy within the same TNS platform.
In practice
Across different kinds of plants
- Injection Moulding
- Track order progress when each machine has a different cycle time and cavity count.
- Automotive
- Find the station that is holding up order completion on the assembly line.
- Packaging
- Track output per shift against the daily target.
- Food & Beverage
- Trace output per batch along with the rejects that came with it.
Integration
It connects to what you already have
No PLC, meter, or ERP needs replacing. Machvory reads from the equipment already installed in your plant.
01
PLCs, sensors, meters
Data at the machine
02
Edge gateway
Acquisition and buffering
03
Machvory integration layer
Modbus, OPC UA, MQTT
04
TNS / OPTIMUS
Analytics and workflow
05
ERP, SAP, BI
Enterprise reporting
- Siemens, Mitsubishi, Omron, Allen-Bradley PLCs
- Modbus TCP and Modbus RTU
- OPC UA
- MQTT
- Power and energy meters
- Vibration, temperature, current sensors
- Existing SCADA and HMI
- ERP and SAP
- REST API and SQL
Next steps
What usually comes next
Start with one need and add the rest when you actually need it.
FAQ
Questions we get a lot
Does it replace our existing ERP or MES?
No. TNS focuses on execution on the production floor and on machine data. Work orders can come from the ERP through an integration, and actuals can be sent back, so the two complement each other.
How is output counted when one cycle makes several units?
The units-per-cycle factor is set per machine and per product, so output stays correct for molds with different cavity counts.
Do we have to replace our existing PLCs or machines?
No. Machvory reads from what is already installed over Modbus, OPC UA, MQTT, or a power meter. Where a machine does not expose the data point we need, we add a sensor or gateway to that machine alone rather than touching its controls.
Can it run on-premise, with no cloud?
Yes. It can run entirely on a server inside the plant, in the cloud, or split between the two. The choice usually comes down to your IT/OT policy and what the plant network can carry.
How long does the first implementation take?
It depends on how ready the data points are and how many machines are involved. We normally start with a pilot on one line or a few critical assets to prove out data quality and the workflow, then widen once it holds up on the floor.
Further reading
See Where Your Orders Stand Mid-Shift
Our engineers look at your machines and the data you already have, then scope a pilot that is realistic to run.
- No obligation to buy
- A reply within business hours
- WhatsApp works too