
TNS · DIGITAL TWIN
See your production floor as a 3D model connected to live data
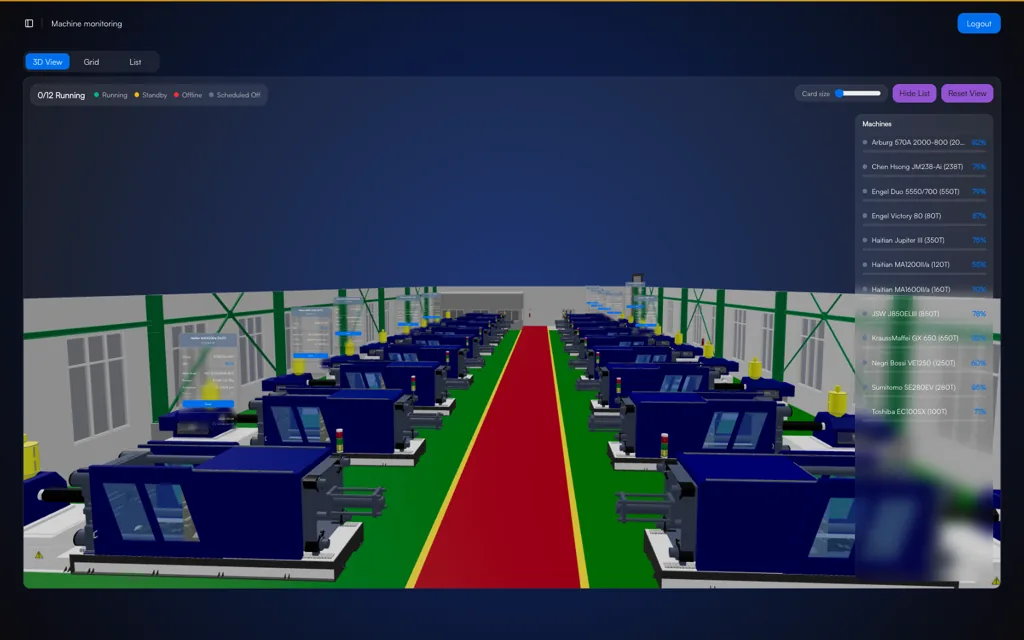
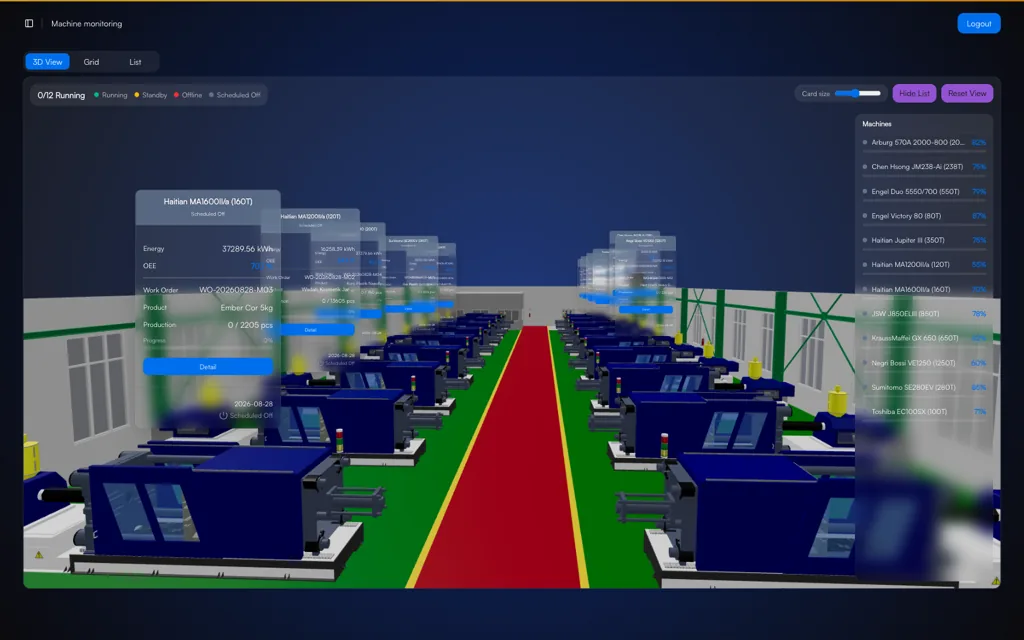
Every machine in the 3D model carries its state, production progress, OEE, energy use, and the work order in progress, so production conditions read in the context of the plant layout.
Platform: TNS · Operations & Visualization
The problem
The production data exists, but it is cut off from its physical context
Tables and charts answer the questions we already know how to ask. When someone who does not open the dashboard every day needs to understand production conditions, a picture of the plant layout is much faster to read.
Signs we usually find
- It takes several screens to understand the state of one line
- Management and visitors struggle to read operational dashboards
- Where the problem machine sits is not immediately clear
- Production and energy context live on different pages
Used by
- Plant Manager
- Production Manager
- Management & Executives
- Continuous Improvement team
Data it reads
- 3D model of the production floor with machine placement
- Real-time machine state and output
- Active work orders and their progress
- Energy use per machine
How it works
From the machine to a decision
01
3D model
Production floor layout
02
Binding
3D objects to machines in the system
03
Live data
State, output, energy
04
Context
Info card per machine
The system
What it looks like on screen
Capabilities
What you can do with it
3D production floor layout
Machines shown in their actual positions in the plant.
State per machine
Running, standby, offline, and scheduled off told apart visually.
Context cards
Energy, OEE, work order, product, and progress shown on the selected machine.
Running summary
How many machines are running against the total, visible at once.
Synced machine list
The list panel and the 3D model point to the same object.
Jump to detail
From a 3D object straight to that machine’s detail page.
Adjustable information density
Card size can be adjusted so the view stays readable.
Built on the same data
No separate data source; the twin reads the same operational data.
On the floor
How it is used day to day
01
Machine
Object in the 3D model
02
Production
Output & work order
03
OEE
Current effectiveness
04
Energy
Consumption right now
05
Follow up
Machine detail
Impact
Why it matters
01
Production conditions readable without long training
A spatial view makes sense to people who do not open the dashboard every day, including management and plant visitors.
02
Physical context speeds up decisions
Knowing where the problem machine sits in the layout helps decide the order of work and how the team moves on the floor.
03
One view for production and energy
Whether a machine is productive and whether it is efficient are answered on the same object, not in two separate reports.
Start with this alone
The Digital Twin needs operational data already flowing. It is usually implemented after production or OEE monitoring is running on the line in question.
In practice
Across different kinds of plants
- Injection Moulding
- Show the state of every machine in a production hall on one screen.
- Automotive
- Point out the station that is holding up production flow on the line.
- Management
- Present plant conditions in meetings and on visits without opening a stack of dashboards.
- Multi-plant
- Give every plant the same way of reading production floor conditions.
Integration
It connects to what you already have
No PLC, meter, or ERP needs replacing. Machvory reads from the equipment already installed in your plant.
01
PLCs, sensors, meters
Data at the machine
02
Edge gateway
Acquisition and buffering
03
Machvory integration layer
Modbus, OPC UA, MQTT
04
TNS / OPTIMUS
Analytics and workflow
05
ERP, SAP, BI
Enterprise reporting
- Siemens, Mitsubishi, Omron, Allen-Bradley PLCs
- Modbus TCP and Modbus RTU
- OPC UA
- MQTT
- Power and energy meters
- Vibration, temperature, current sensors
- Existing SCADA and HMI
- ERP and SAP
- REST API and SQL
Next steps
What usually comes next
Start with one need and add the rest when you actually need it.
FAQ
Questions we get a lot
Do we have to supply a 3D model of the plant?
Not necessarily. The model can be built from floor plans, photos, and machine dimensions. If a model from the plant design already exists, it can be used after it is simplified to stay light in the browser.
Is the Digital Twin just a visualization?
Every object in the model is bound to the same machine the OEE, production, and energy modules use. The numbers in the twin and on the dashboard always match because they come from one source.
Do we have to replace our existing PLCs or machines?
No. Machvory reads from what is already installed over Modbus, OPC UA, MQTT, or a power meter. Where a machine does not expose the data point we need, we add a sensor or gateway to that machine alone rather than touching its controls.
Can it run on-premise, with no cloud?
Yes. It can run entirely on a server inside the plant, in the cloud, or split between the two. The choice usually comes down to your IT/OT policy and what the plant network can carry.
How long does the first implementation take?
It depends on how ready the data points are and how many machines are involved. We normally start with a pilot on one line or a few critical assets to prove out data quality and the workflow, then widen once it holds up on the floor.
See Your Plant Layout With Live Data
Our engineers look at your machines and the data you already have, then scope a pilot that is realistic to run.
- No obligation to buy
- A reply within business hours
- WhatsApp works too