
TNS · ENERGY MOBILE
Energy findings that reach the person who can act on them
An energy dashboard waits for someone to open it. The TNS Energy app puts each finding on the phone of the person who decides, with the cost figure, the calculation behind it, and a follow-up you can assign.
Platform: TNS · Energy
The problem
Energy data stops at a screen nobody opens
Energy dashboards usually live on a control room PC, while the people with the authority to stop the waste are out walking the plant. The result is that a finding gets read days later, after the cost has already been paid.
Signs we usually find
- The dashboard only gets opened to build the monthly report
- Managers learn about a consumption spike from the bill, not from the system
- Findings never turn into an assignment anyone tracks
- Savings figures get passed around with no calculation attached
Used by
- Plant Manager
- Energy Manager
- Utility / Engineering Manager
- Executives who watch operating cost
Data it reads
- Continuous per-equipment consumption from the same meters and gateway the web platform uses
- Contracted demand and the electricity tariff that applies at the site
- Operating hours or the usage calendar for buildings and production lines
How it works
From the machine to a decision
01
Measure
Consumption per equipment
02
Detect
Patterns that drift
03
Calculate
Impact in cost
04
Assign
A named follow-up
05
Verify
Compare against the baseline
The system
What it looks like on screen
Capabilities
What you can do with it
The day on one screen
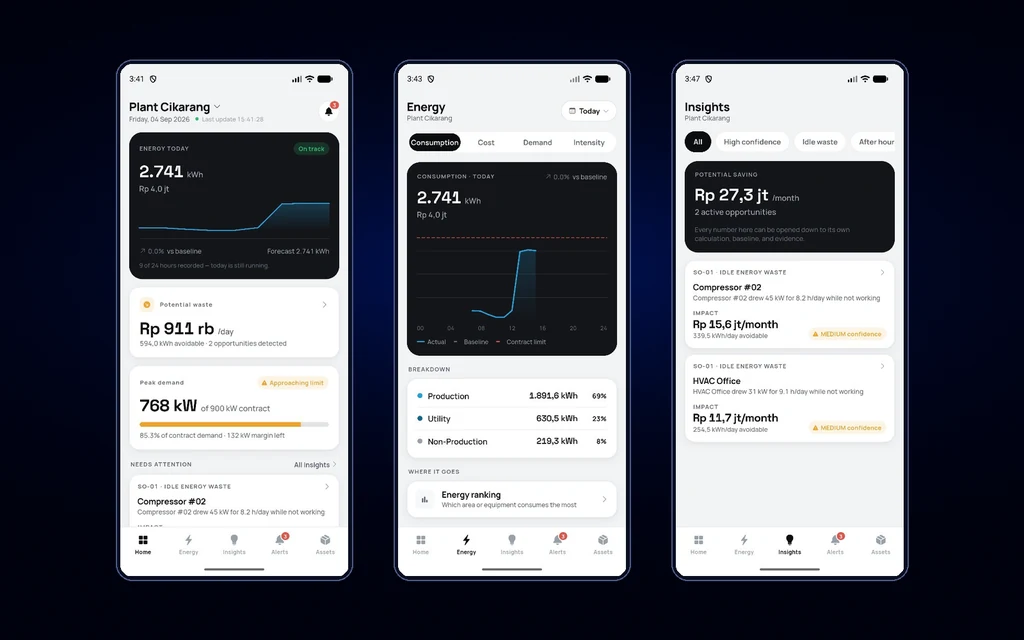
Consumption so far today, what it costs, potential waste, and where peak demand sits against contracted demand, readable before the morning meeting starts.
Findings that carry their math
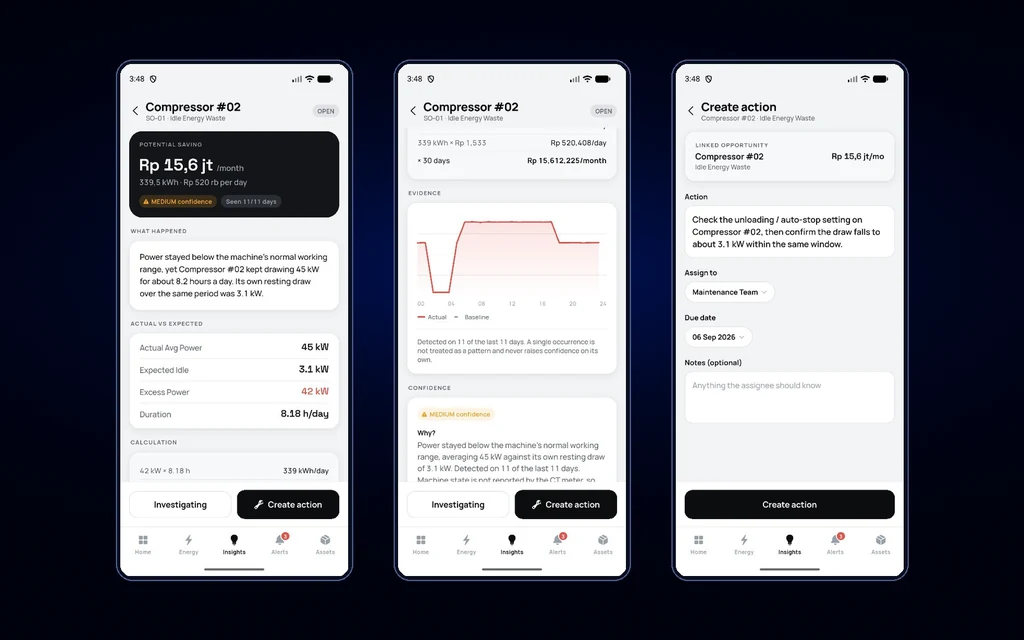
Every cost figure opens down to the arithmetic, the baseline, and the evidence curve. The number and how it was calculated are never separated.
Confidence stated openly
A finding inferred from power data alone is marked MEDIUM confidence, with the reason written on screen. The app does not make claims the product cannot back.
Consumption ranked by equipment and area
Equipment and areas are sorted by kWh and cost, so fixes start with the biggest impact, not the easiest job.
Peak demand against contracted demand
Running demand is read against the contract limit all day, with a warning as it gets close, not after the bill arrives.
Follow-ups you can assign
A finding becomes a named job with a deadline, tracked until it is closed along with its verification result.
Missing data is shown, not hidden
Hours not yet recorded show as empty blocks, not as zero. A meter that stops reporting is flagged, so a chart never misrepresents what it covers.
Android and iOS, one permission
Built with Flutter for Android 8.0 and up and iOS 12 and up. The app asks only for INTERNET permission: no camera, location, storage, or contacts.
On the floor
How it is used day to day
01
Open
Summary of the day so far
02
Drill down
Area, system, then equipment
03
Check
The calculation and its evidence
04
Assign
A follow-up with a deadline
05
Close
Once the result is measured
Impact
Why it matters
01
Less time between finding and action
A finding no longer waits for someone to open the dashboard. It reaches the phone of the person with the authority to stop it, on the day it appears.
02
Numbers that hold up in a meeting
Every cost figure carries its calculation lines and evidence curve, so the discussion moves from arguing about the number to deciding what to do.
03
Product limits stated, not hidden
Confidence levels and data that is not yet available are shown as they are. A system that is honest about its limits is easier to trust with cost decisions.
04
One data source with the web platform
The app and the dashboard read the same database. There is no reconciling the numbers seen on the floor with the ones reported to management.
Start with this alone
The app can start alongside energy monitoring on a few of the most wasteful pieces of equipment, with no other modules. As coverage grows, new equipment and areas show up in the app without reinstalling anything.
In practice
Across different kinds of plants
- Manufacturing
- A compressor keeps drawing power outside production hours. The finding reaches the utility manager’s phone with the power difference, the duration, and its monthly cost.
- Commercial buildings & hotels
- A chiller is never staged off even when night occupancy is low. The app flags it as idle consumption and compares it with similar units in the same system.
- Education facilities
- Air conditioning and lighting stay on outside class hours and through the weekend. The gap against the building calendar reads directly as avoidable cost.
- Multi-site
- One account switches between plants or buildings, so management can compare sites without opening three different systems.
Integration
It connects to what you already have
No PLC, meter, or ERP needs replacing. Machvory reads from the equipment already installed in your plant.
01
PLCs, sensors, meters
Data at the machine
02
Edge gateway
Acquisition and buffering
03
Machvory integration layer
Modbus, OPC UA, MQTT
04
TNS / OPTIMUS
Analytics and workflow
05
ERP, SAP, BI
Enterprise reporting
- Siemens, Mitsubishi, Omron, Allen-Bradley PLCs
- Modbus TCP and Modbus RTU
- OPC UA
- MQTT
- Power and energy meters
- Vibration, temperature, current sensors
- Existing SCADA and HMI
- ERP and SAP
- REST API and SQL
Next steps
What usually comes next
Start with one need and add the rest when you actually need it.
FAQ
Questions we get a lot
Does the app replace the web dashboard?
No. They answer different questions from the same data. The app answers the daily ones: what you need to know this morning and what looks wrong. The web dashboard answers the periodic ones: monthly trends, year-over-year comparisons, and exportable reports.
Why are so many findings marked MEDIUM and not HIGH?
Because a current sensor only measures electricity; it gets no state signal from the machine. When "not working" is inferred from the power pattern alone, confidence is capped at MEDIUM and the reason is written on screen. Confidence goes up when machine state is available from a PLC or the production system.
Can we use it without installing other TNS modules?
Yes. The app only needs energy measurement per equipment. The OEE, downtime, and production modules are not required, and they can be added later without changing the installation already in place.
Do we have to replace our existing PLCs or machines?
No. Machvory reads from what is already installed over Modbus, OPC UA, MQTT, or a power meter. Where a machine does not expose the data point we need, we add a sensor or gateway to that machine alone rather than touching its controls.
Can it run on-premise, with no cloud?
Yes. It can run entirely on a server inside the plant, in the cloud, or split between the two. The choice usually comes down to your IT/OT policy and what the plant network can carry.
How long does the first implementation take?
It depends on how ready the data points are and how many machines are involved. We normally start with a pilot on one line or a few critical assets to prove out data quality and the workflow, then widen once it holds up on the floor.
See Energy Findings on Your Phone
Our engineers look at your machines and the data you already have, then scope a pilot that is realistic to run.
- No obligation to buy
- A reply within business hours
- WhatsApp works too