
Industries
The problem looks different in every kind of plant
The nature of the process decides which losses cost the most. This page maps the problems we meet most often in each industry, the indicators plants usually track, and the capabilities that handle them.
01
Manufacturing
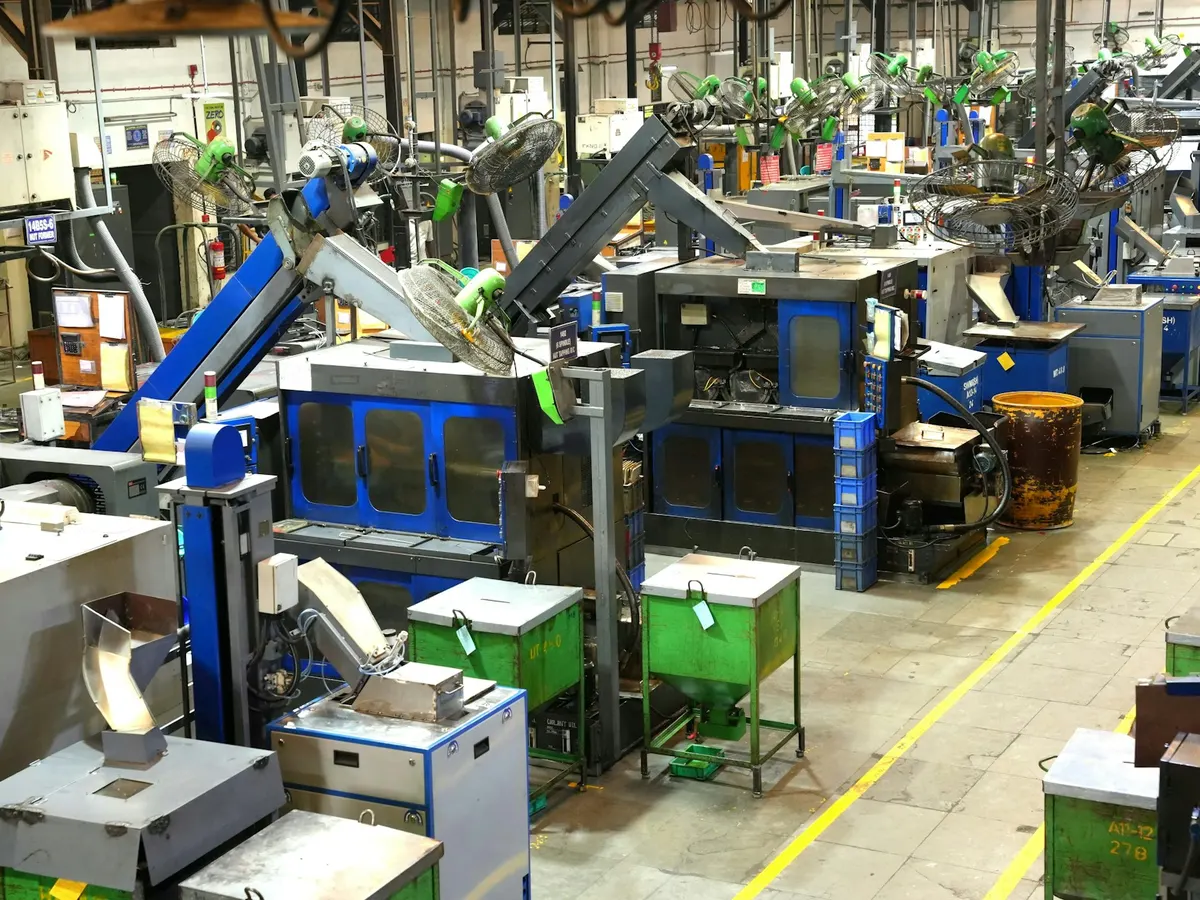
Many similar machines, daily output targets, and a maintenance team stretched thin.
See details
02
Automotive
Tight takt times, delivery commitments that cannot slip, and demanding quality targets.
See details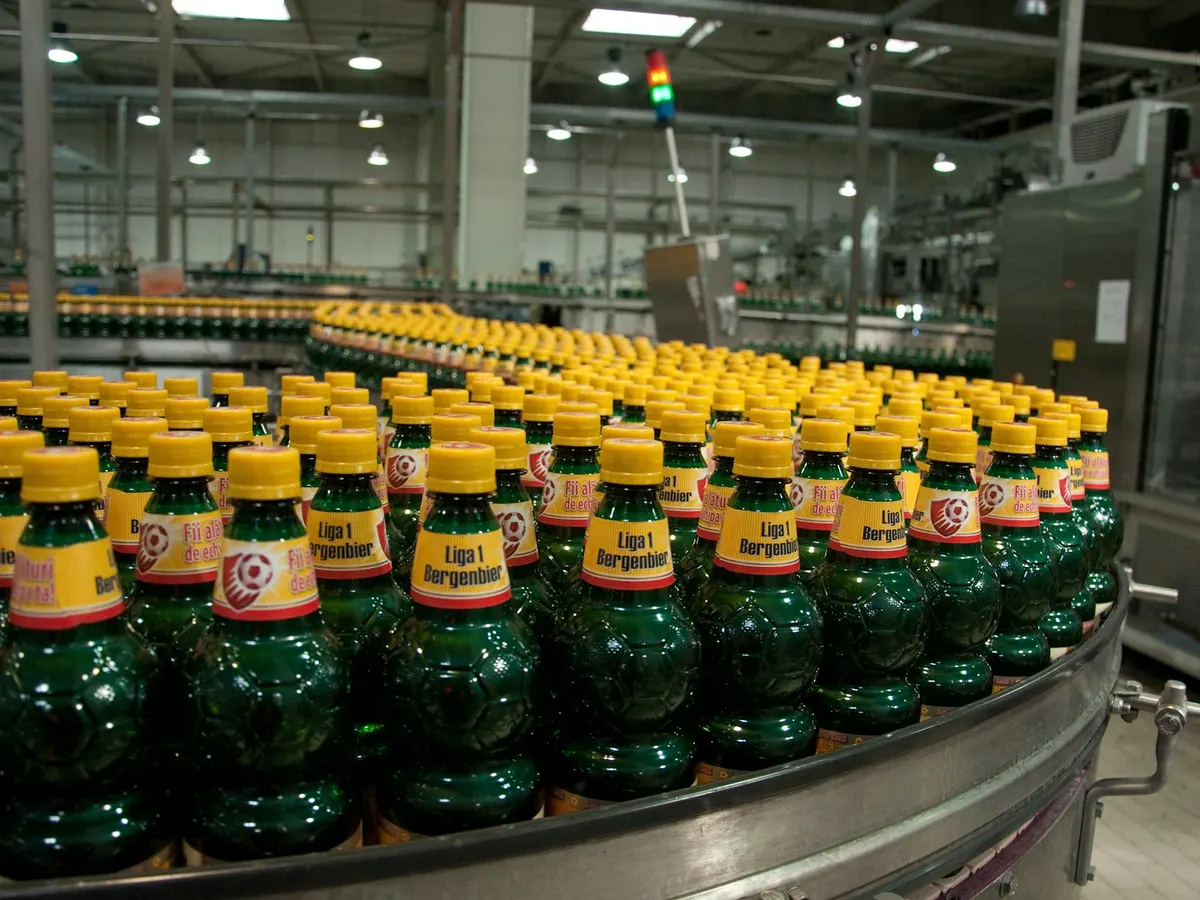
03
Food & Beverage
Heavy energy use in cooling and heating, and traceability per batch.
See details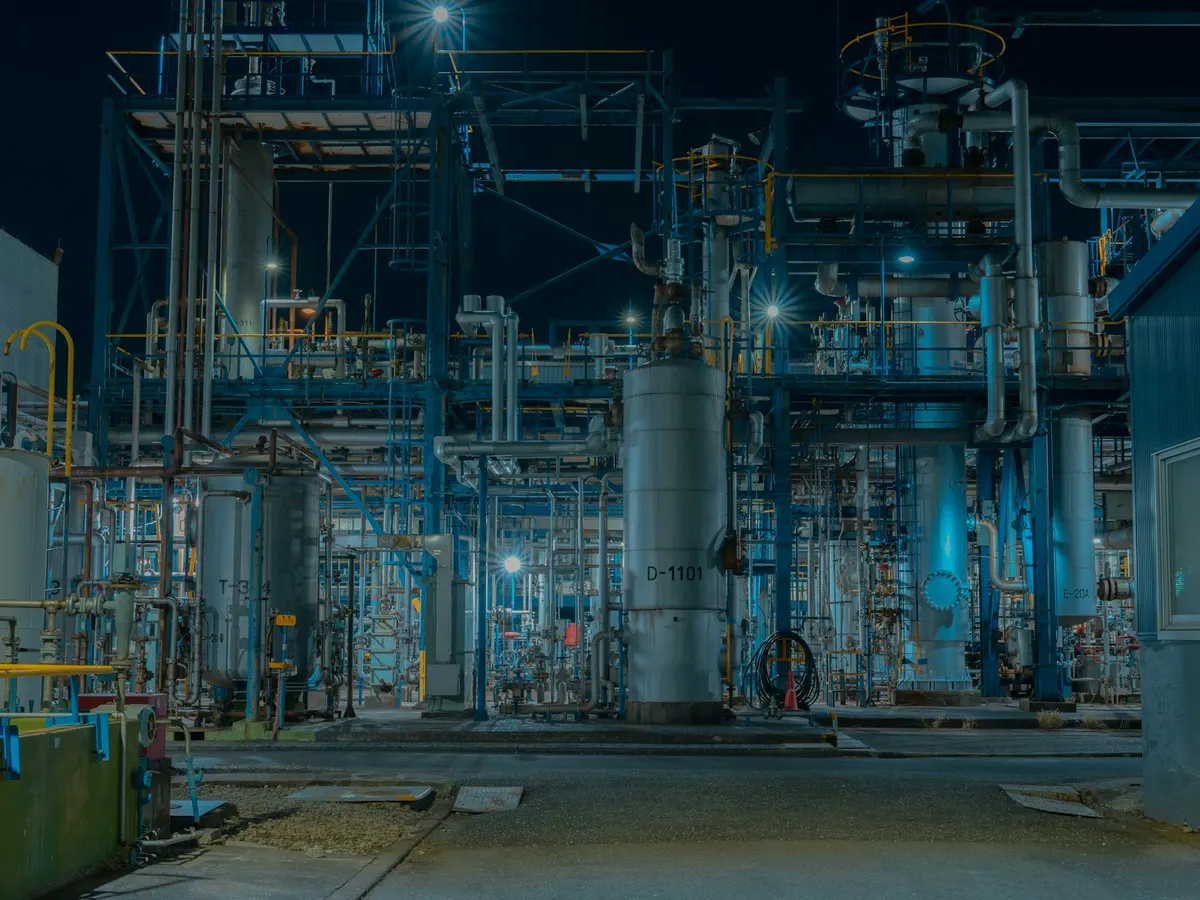
04
Process Industry
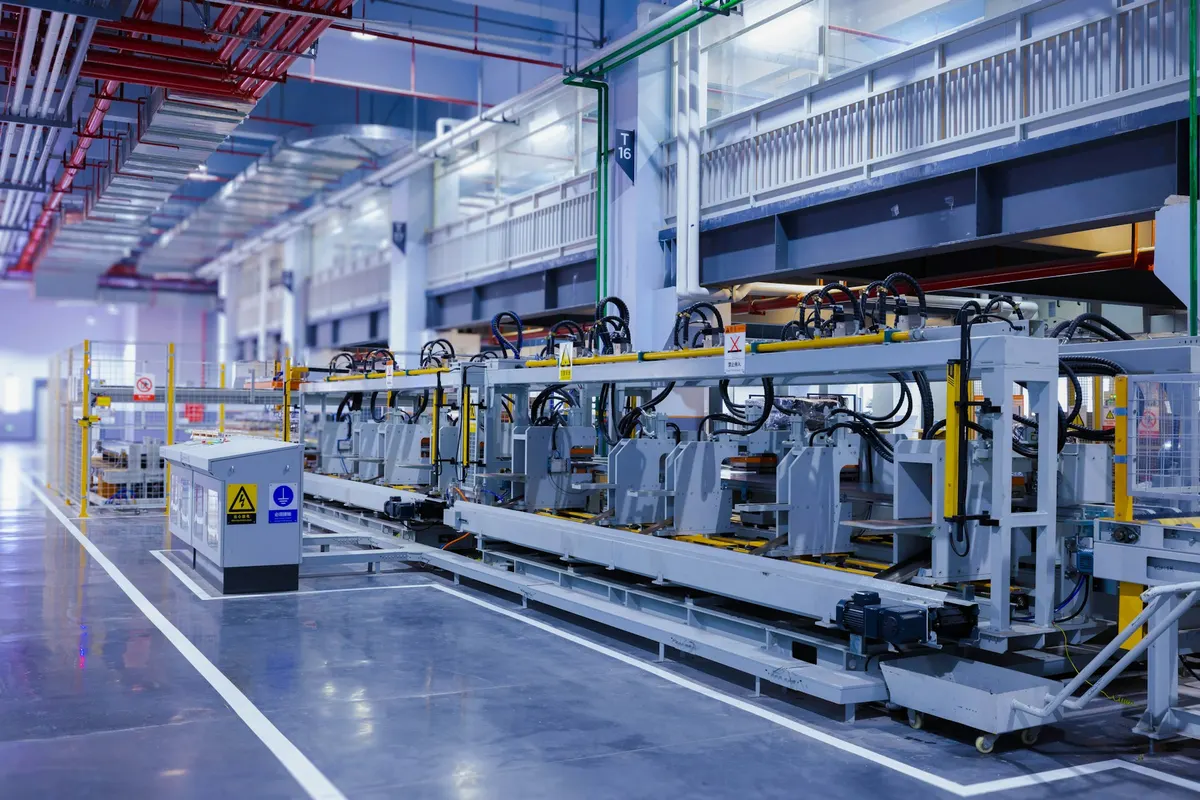
Critical rotating equipment running around the clock, where stopping is expensive.
See details01Manufacturing
Many similar machines, daily output targets, and a maintenance team stretched thin.
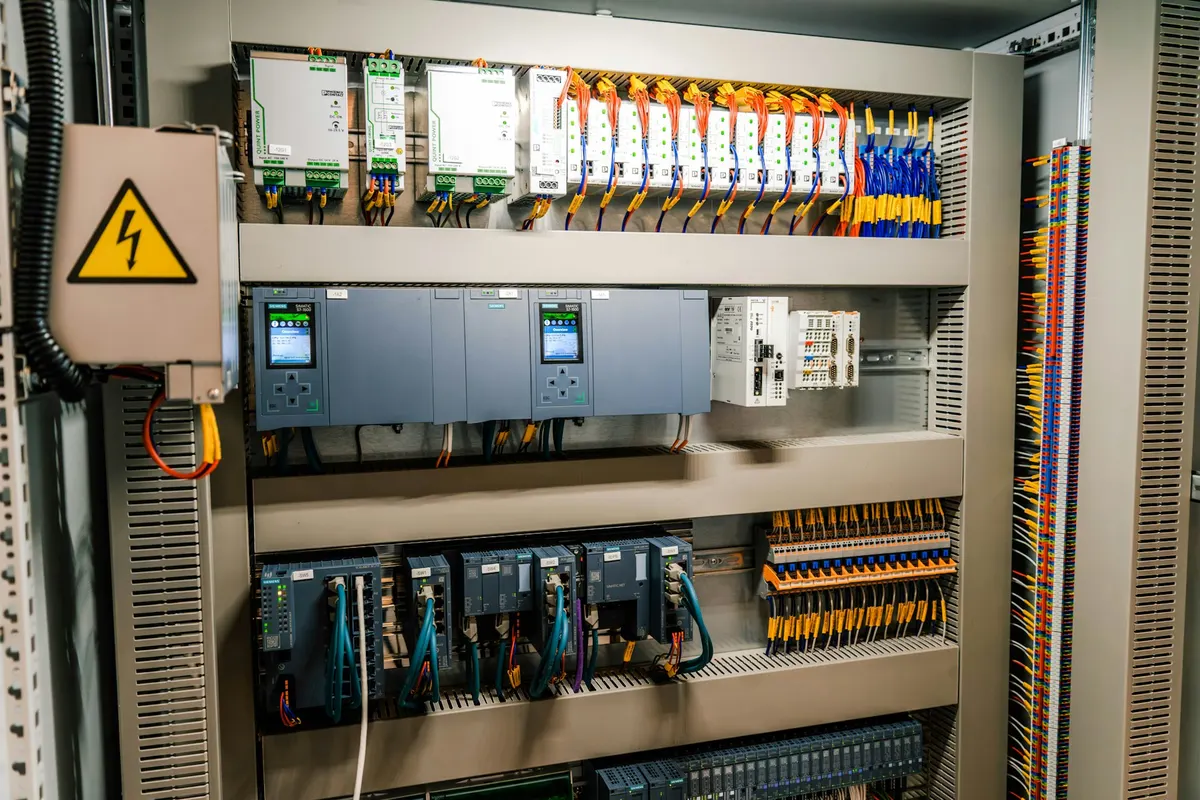
Discrete manufacturers of metal, plastic, or electronic parts usually run dozens of similar machines against tight daily targets. The problem is rarely one big breakdown. More often, capacity leaks away a little at a time across many machines, and nobody sees the total.
Indicators usually tracked
- OEE per machine and shift
- Downtime and its causes
- Energy per unit of output
- PM schedule compliance
What we usually find
- 1
Output trails installed capacity
Targets slip, but the cause depends on who you ask: machines stopping, running slow, or producing defects.
- 2
Energy is only known at plant level
The electricity bill arrives every month, but nobody knows which machine uses the most or how much energy goes into each unit.
- 3
Maintenance history is scattered
Repair notes live in logbooks, spreadsheets, and WhatsApp groups, so recurring failure patterns are hard to find.
Relevant capabilities
Related case studies


Further reading

02Automotive
Tight takt times, delivery commitments that cannot slip, and demanding quality targets.
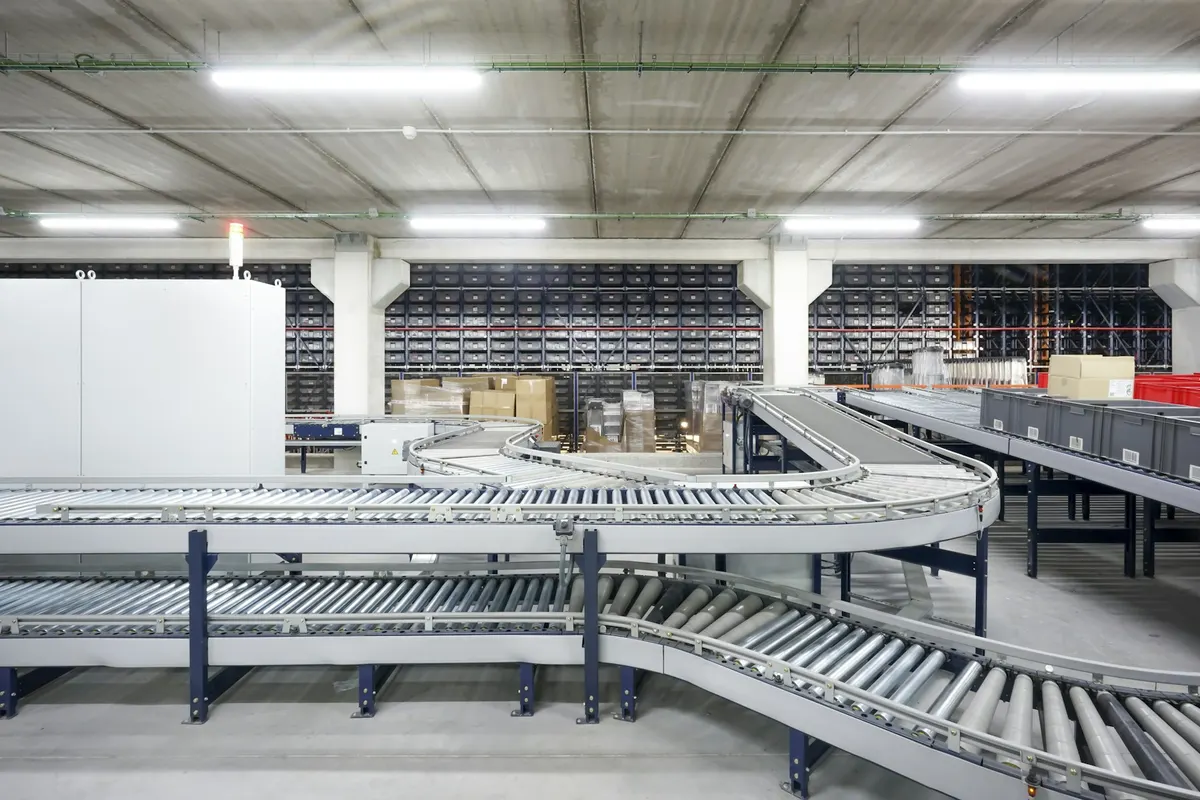
Automotive component suppliers work to delivery schedules locked to their customers’ assembly lines. A few minutes lost at one station can ripple through the whole line, and every quality deviation has to be traceable.
Indicators usually tracked
- Downtime per station
- Actual output against target
- Response time to stoppages
- Bottleneck machine condition
What we usually find
- 1
Repeated short stops
One- or two-minute stops are rarely recorded, yet dozens of them per shift can cost more than a single major breakdown.
- 2
Shift differences are hard to prove
Everyone feels one shift runs slower, but without per-shift data the discussion never gets past opinion.
- 3
Critical machines hit deliveries directly
A bottleneck machine has no standby, so every hour it is down lands on a customer commitment.
Relevant capabilities
Related case studies

Further reading

03Food & Beverage
Heavy energy use in cooling and heating, and traceability per batch.
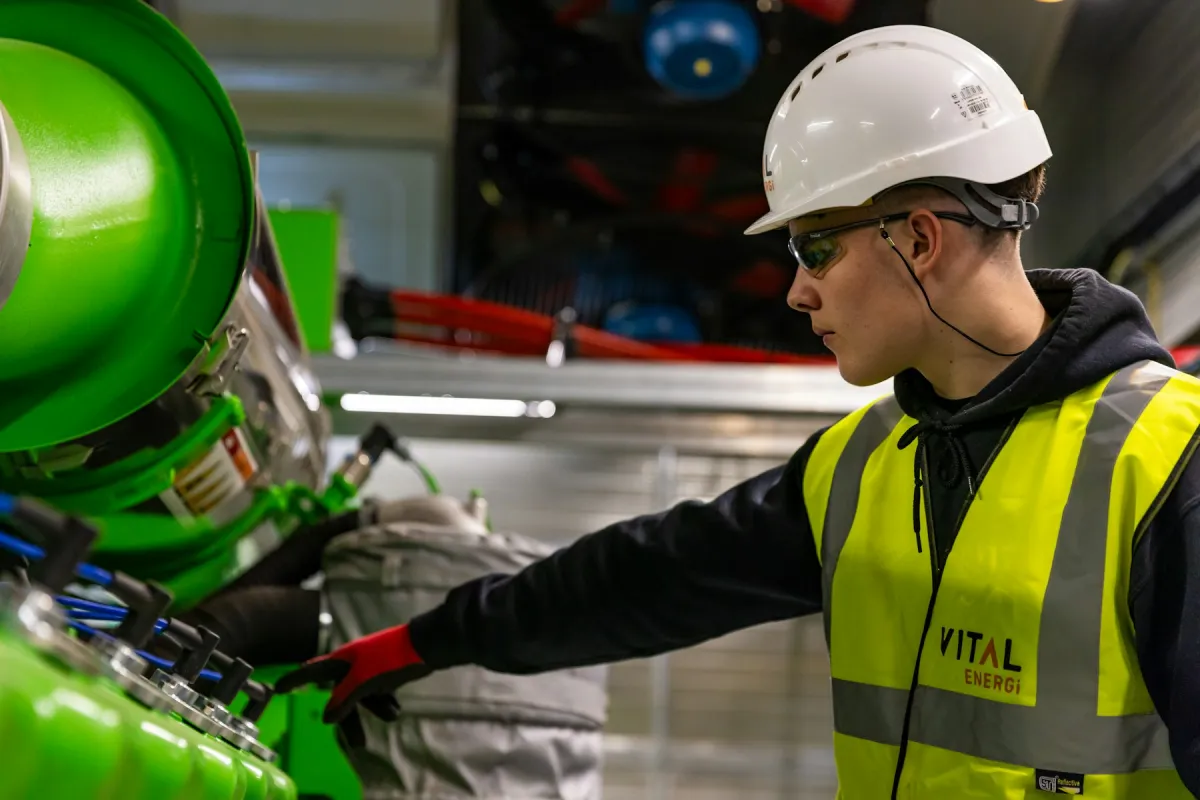
Food and beverage plants combine high-speed packing lines with energy-hungry utilities: chillers, boilers, compressors, and cold storage. Utility energy cost often matters as much as the performance of the line itself.
Indicators usually tracked
- Energy per unit of product
- Utility consumption per area
- Changeover time
- Checksheet compliance
What we usually find
- 1
Process and utility energy blur together
Chiller, boiler, and compressor consumption all land in one bill, so the savings opportunities stay invisible.
- 2
Changeover loss is not separated
Product changes and cleaning are logged together with machine faults, so improvement efforts aim at the wrong thing.
- 3
Inspection compliance is hard to prove
Paper checksheets get lost or filled in later, while quality and food safety audits ask for tidy evidence.
Relevant capabilities
Further reading
04Process Industry
Critical rotating equipment running around the clock, where stopping is expensive.
In process industries such as chemicals, oil and gas, or water treatment, pumps, compressors, and blowers run almost without pause. When one critical asset fails, it is not one machine that stops but the whole process downstream of it.
Indicators usually tracked
- Asset vibration and temperature
- Asset health score
- Active alarms per area
- MTBF of critical assets
What we usually find
- 1
Condition is only known at inspections
Periodic readings capture one moment. Change that develops between two inspections goes unseen.
- 2
Alarming assets are hard to find
Across a large site with hundreds of tags, locating the physical asset behind an alarm costs valuable time.
- 3
Maintenance priorities are not objective
With many assets and a small team, work is often prioritized by whoever asks loudest.
Relevant capabilities
Further reading

What is the same in every industry
The industry name may differ; the way we start does not.
01
Start from the machines you have
Data is read from the PLCs, meters, and sensors already installed. New sensors are added only where a data point is missing.
02
Pilot on critical assets
One line or a few assets with the largest impact, so the result can be verified before it is widened.
03
Data turns into action
Findings end in a work order, a schedule, or a clear decision, not on a dashboard.
Your industry is not on this list?
Our approach depends on the kind of machines and the data available, not the industry name. Tell us about your process and we will assess whether it fits.
- No obligation to buy
- A reply within business hours
- WhatsApp works too