
OPTIMUS · ASSET HEALTH
Prioritize assets by risk, not by gut feeling
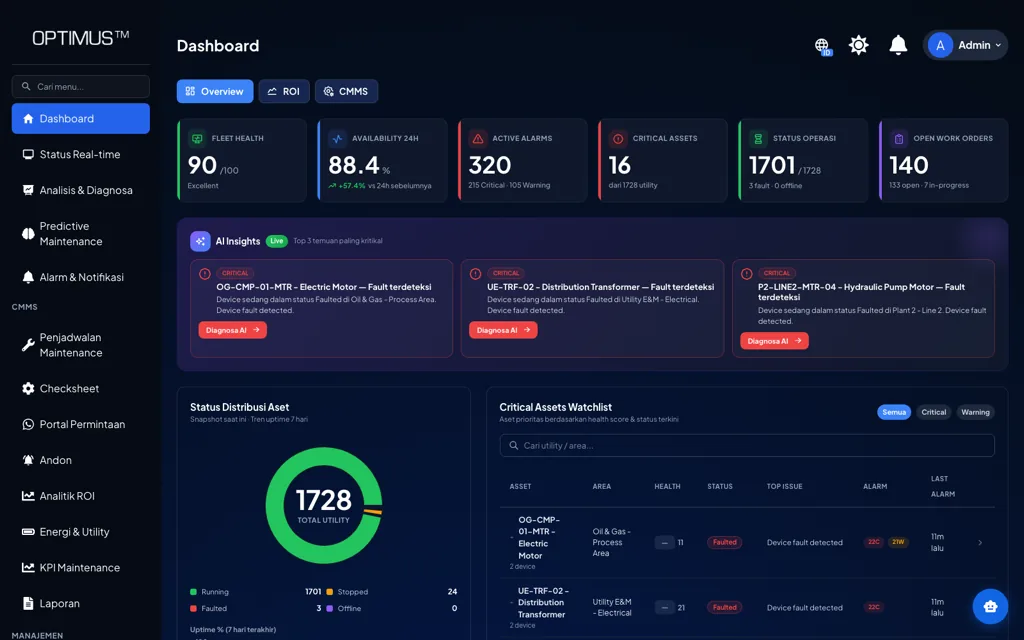
A health score per asset, a ranking based on condition and criticality, and a watchlist of critical assets that makes the order of work clear.
Platform: OPTIMUS · Asset Reliability
The problem
Every asset is treated as equally important
With limited maintenance resources, the order you work in decides the impact. Without a condition indicator you can compare, that order is often set by whoever complains the loudest.
Signs we usually find
- No single indicator to compare condition across assets
- Asset criticality plays no part in setting priority
- Gradual condition decline goes unnoticed
- The critical asset watchlist is put together by hand
Used by
- Reliability Engineer
- Maintenance Manager
- Plant Manager
- Asset Management Team
Data it reads
- Asset condition and status data
- Alarm and maintenance work history
- Asset criticality and class
How it works
From the machine to a decision
01
Condition
Telemetry & alarm data
02
Health score
Indicator per asset
03
Ranking
Combined with criticality
04
Watchlist
Priority assets
The system
What it looks like on screen
Capabilities
What you can do with it
Health score per asset
Condition summed up in one indicator you can compare across assets.
Risk ranking
Assets ranked by both condition and criticality.
Critical watchlist
The assets that need attention now, gathered in one list.
Gradual decline detection
Condition that worsens slowly still shows up as a trend.
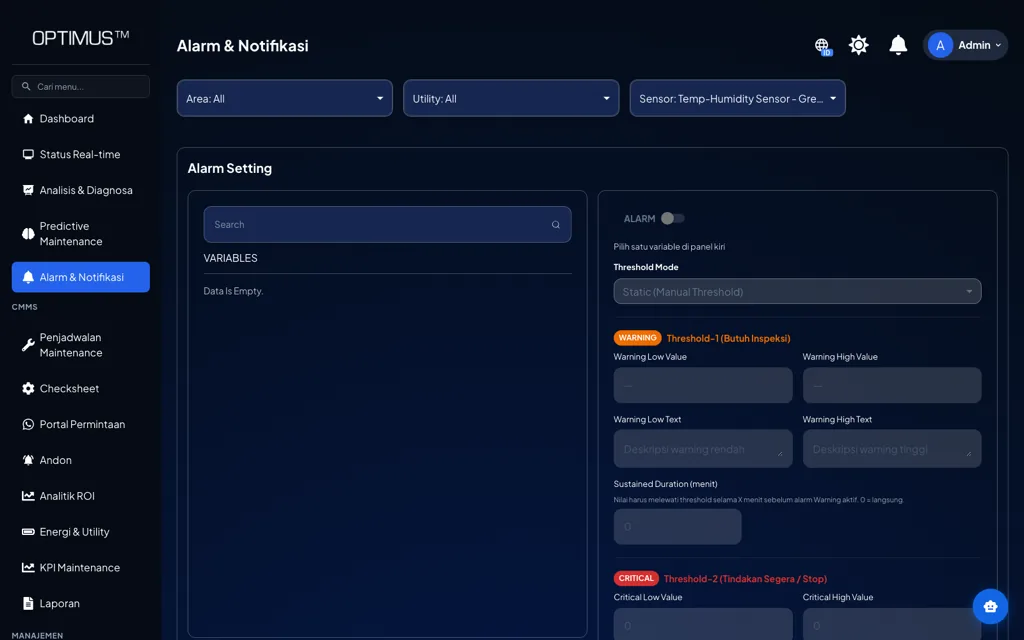
Alarm severity
Alarms split into warning and critical, with their history.
Asset status distribution
How many assets sit in each status, read as a picture of plant health.
Diagnostic context
Findings come with supporting data to speed up the analysis.
Linked to action
An at-risk asset can be passed straight into a CMMS job.
On the floor
How it is used day to day
01
Condition tracked
Continuous data
02
Health score
Updated automatically
03
Prioritize
Highest-risk assets
04
Act
Inspection or repair
Impact
Why it matters
01
Maintenance effort goes where it matters
With a clear risk order, the team works on what has the most impact first, not on whatever they get reminded about most.
02
A plant health overview for management
The spread of asset condition gives a high-level summary without reading through every machine.
03
A basis for asset replacement planning
An asset whose condition keeps dropping despite several repairs becomes a replacement candidate you can justify.
Start with this alone
Asset health is most useful once some of the critical assets already have condition monitoring. Coverage can grow step by step as more assets are instrumented.
In practice
Across different kinds of plants
- Manufacturing
- Build a weekly watchlist of critical assets for the maintenance meeting.
- Oil & Gas
- Set inspection priorities in areas with a lot of rotating equipment.
- Utility
- Track transformer and compressor condition in a single risk ranking.
- Asset Management
- Prepare the data behind the annual asset replacement plan.
Integration
It connects to what you already have
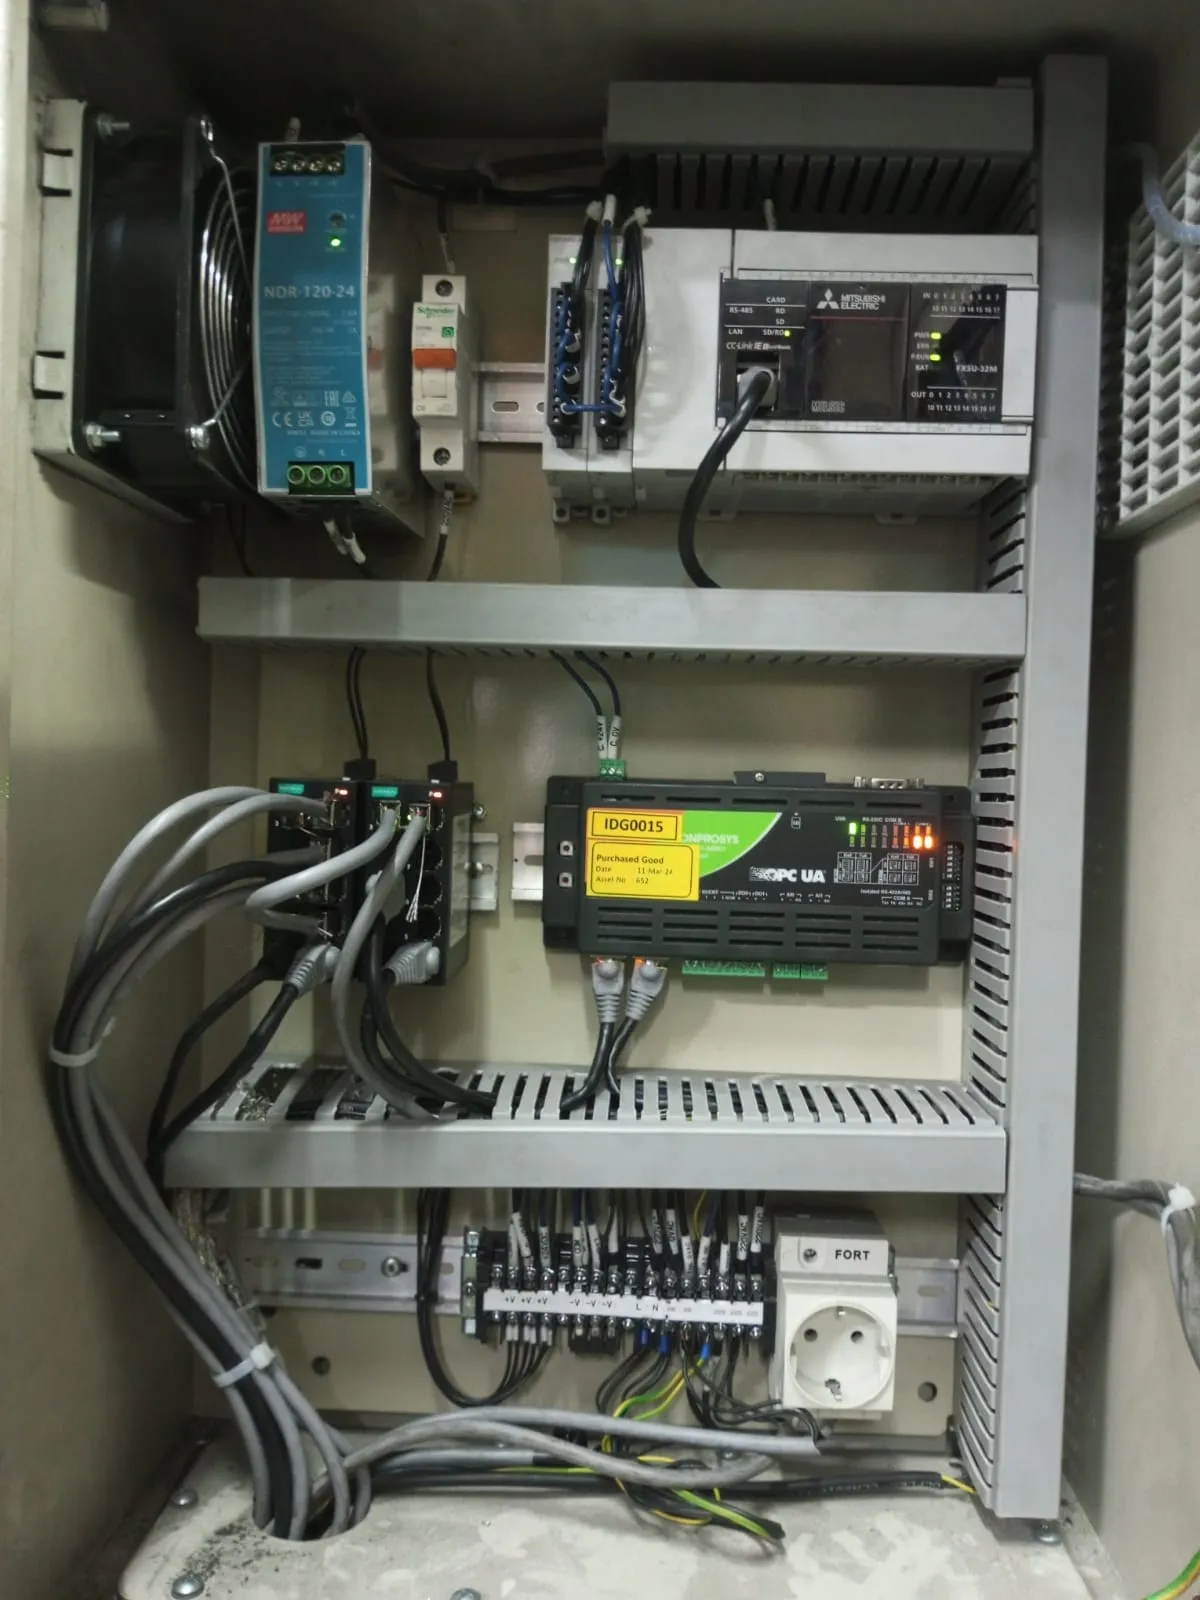
No PLC, meter, or ERP needs replacing. Machvory reads from the equipment already installed in your plant.
01
PLCs, sensors, meters
Data at the machine
02
Edge gateway
Acquisition and buffering
03
Machvory integration layer
Modbus, OPC UA, MQTT
04
TNS / OPTIMUS
Analytics and workflow
05
ERP, SAP, BI
Enterprise reporting
- Siemens, Mitsubishi, Omron, Allen-Bradley PLCs
- Modbus TCP and Modbus RTU
- OPC UA
- MQTT
- Power and energy meters
- Vibration, temperature, current sensors
- Existing SCADA and HMI
- ERP and SAP
- REST API and SQL
Next steps
What usually comes next
Start with one need and add the rest when you actually need it.
FAQ
Questions we get a lot
How is the health score calculated?
The score is built from the asset’s measured condition, its alarm history, and its operating status. The weight of each component can be adjusted to the asset type and to how your company assesses risk, so the score means something in your context.
Can it be used for assets without sensors?
For assets with no instrumentation, the assessment relies on work history and inspection results. The score is still useful for ranking, but it is less detailed than for assets that are monitored continuously.
Does this guarantee every failure gets predicted?
No, and we do not claim it does. What the system does is watch condition continuously, flag changes and anomalies early, and give enough context for the maintenance team to decide on an action before things turn critical. The final call stays with the engineer.
Do we have to replace our existing PLCs or machines?
No. Machvory reads from what is already installed over Modbus, OPC UA, MQTT, or a power meter. Where a machine does not expose the data point we need, we add a sensor or gateway to that machine alone rather than touching its controls.
Can it run on-premise, with no cloud?
Yes. It can run entirely on a server inside the plant, in the cloud, or split between the two. The choice usually comes down to your IT/OT policy and what the plant network can carry.
How long does the first implementation take?
It depends on how ready the data points are and how many machines are involved. We normally start with a pilot on one line or a few critical assets to prove out data quality and the workflow, then widen once it holds up on the floor.
Further reading
- Signs of a failing motor bearing and how to catch it before it seizes
- Why an electric motor runs hot, and what to do about it
- What is condition monitoring? Definition, techniques, and how to start in a plant
- Root cause analysis (RCA) in maintenance: 5 Whys, fishbone, and how to run one
- How to calculate MTBF and MTTR, and how to read them correctly
- Machine vibration analysis: basics, parameters, and how to read the results
- What is predictive maintenance? Definition, techniques, and how to implement it
See How Your Assets Rank by Risk
Our engineers look at your machines and the data you already have, then scope a pilot that is realistic to run.
- No obligation to buy
- A reply within business hours
- WhatsApp works too