
TNS · DOWNTIME MONITORING
Know when a machine stopped, for how long, and why
Automatic stop detection from machine data, measured duration, cause categories, and the repeat patterns that usually stay invisible in a daily recap.
Platform: TNS · Productivity
The problem
Downtime gets logged after the fact, and often incompletely
When logging depends on an operator remembering at the end of the shift, short repeated stops almost always go missing. Yet the pile-up of short stops is often the biggest single contributor to lost time.
Signs we usually find
- Stops under five minutes never get recorded
- Downtime duration is an estimate, not a measurement
- Repeat causes go unnoticed because the data is scattered
- Planned and unplanned downtime are lumped into one number
Used by
- Maintenance Manager
- Production Supervisor
- Continuous Improvement Engineer
- Plant Manager
Data it reads
- Real-time machine state from PLC, sensor, or power signature
- Master data for stop reasons (reason codes) and their categories
- Production schedule, to separate planned from unplanned
How it works
From the machine to a decision
01
Detect automatically
The system sees the machine stop
02
Measure duration
Start to finish
03
Add context
Reason code & category
04
Analyze patterns
Pareto & repeats
The system
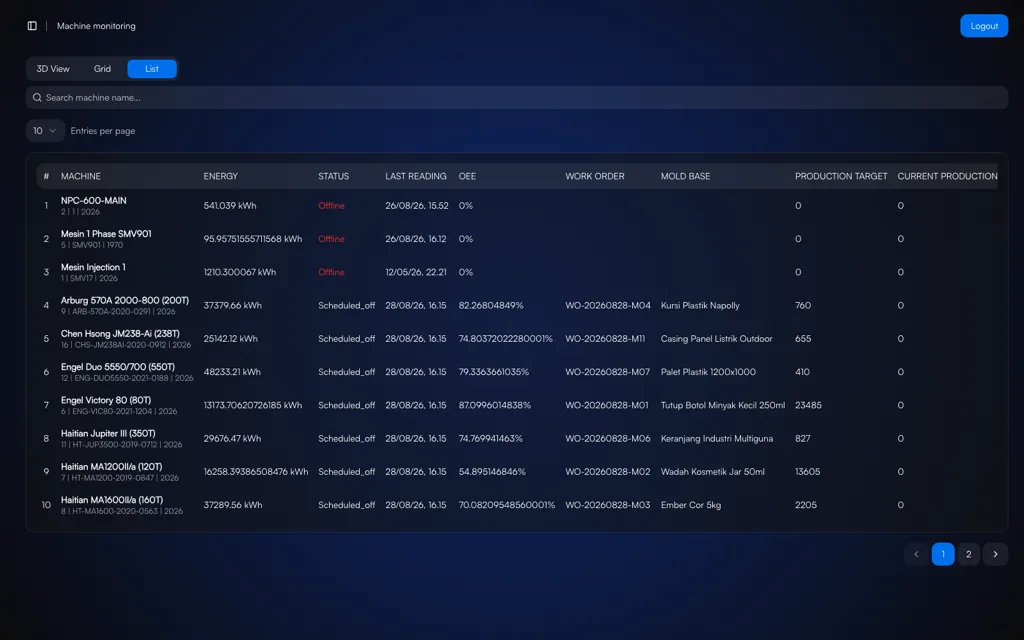
What it looks like on screen
Capabilities
What you can do with it
Automatic detection
Downtime is recorded as it happens, including the short stops that usually slip past manual logs.
Measured duration
Start and end times come from machine data, not estimates.
Reason codes
Every event can carry a reason and a category, so the analysis means something.
Planned vs unplanned
Planned changeovers no longer get mixed up with machine trouble.
Loss Pareto
Downtime causes ranked by total time lost.
Repeat downtime
Patterns that keep coming back are flagged for root-cause analysis.
Impact priority
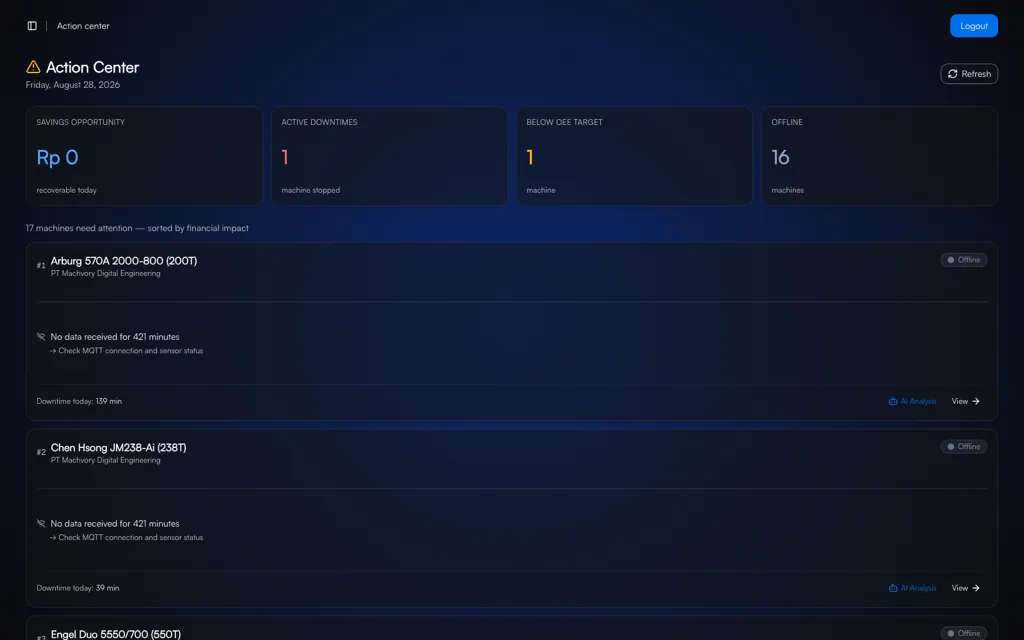
Machines are ranked by impact, so you know which to deal with first.
Offline machine detection
A machine that stops sending data is flagged separately from one that stops producing.
On the floor
How it is used day to day
01
Machine stops
Detected automatically
02
Reason logged
By operator or system
03
Accumulated
Per machine & category
04
Root cause
Repeat patterns get acted on
Impact
Why it matters
01
Hidden losses become visible
Short repeated stops rarely make it into a manual report, yet together they can add up to more than one big breakdown. Automatic detection brings them out.
02
Fixes aimed at causes, not symptoms
Once a repeat cause is identified, maintenance works on the root problem instead of repeating the same repair every week.
03
A basis for capacity planning
Lost production time becomes a number you can use to discuss output targets realistically.
Start with this alone
Downtime Monitoring can run on its own on the line that gives the most trouble. When downtime needs to turn into scheduled maintenance work, OPTIMUS CMMS picks up the flow.
In practice
Across different kinds of plants
- Injection Moulding
- Separate mold change time from hydraulic trouble on the same machine.
- Automotive
- Trace short repeated stops at one station on the assembly line.
- Packaging
- Measure how lost hours affect the daily output target.
- Utility
- Tell apart machines that stopped on schedule from machines that lost their connection.
Integration
It connects to what you already have
No PLC, meter, or ERP needs replacing. Machvory reads from the equipment already installed in your plant.
01
PLCs, sensors, meters
Data at the machine
02
Edge gateway
Acquisition and buffering
03
Machvory integration layer
Modbus, OPC UA, MQTT
04
TNS / OPTIMUS
Analytics and workflow
05
ERP, SAP, BI
Enterprise reporting
- Siemens, Mitsubishi, Omron, Allen-Bradley PLCs
- Modbus TCP and Modbus RTU
- OPC UA
- MQTT
- Power and energy meters
- Vibration, temperature, current sensors
- Existing SCADA and HMI
- ERP and SAP
- REST API and SQL
Next steps
What usually comes next
Start with one need and add the rest when you actually need it.
FAQ
Questions we get a lot
What is the shortest stop it can detect?
That depends on the data resolution from the machine. The faster the state is polled, the shorter the stop that can be recognized. The interval is set together during commissioning to suit the machine.
Do operators still need to enter the stop reason?
Detection and measurement run without the operator. Entering the reason is still needed, because the system can tell that a machine stopped but does not always know why.
Do we have to replace our existing PLCs or machines?
No. Machvory reads from what is already installed over Modbus, OPC UA, MQTT, or a power meter. Where a machine does not expose the data point we need, we add a sensor or gateway to that machine alone rather than touching its controls.
Can it run on-premise, with no cloud?
Yes. It can run entirely on a server inside the plant, in the cloud, or split between the two. The choice usually comes down to your IT/OT policy and what the plant network can carry.
How long does the first implementation take?
It depends on how ready the data points are and how many machines are involved. We normally start with a pilot on one line or a few critical assets to prove out data quality and the workflow, then widen once it holds up on the floor.
Audit Your Downtime Losses
Our engineers look at your machines and the data you already have, then scope a pilot that is realistic to run.
- No obligation to buy
- A reply within business hours
- WhatsApp works too