
TNS · ENERGY MONITORING
Know what every machine draws, not just the total bill
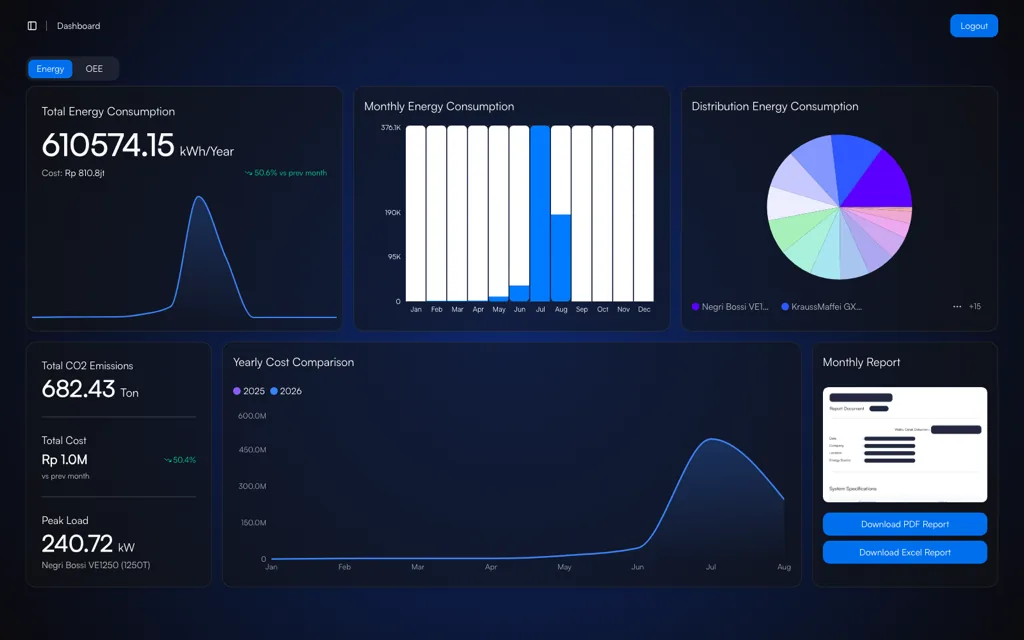
Track kWh, power, current, voltage, power factor, demand, and energy per unit of output in real time, so you can see which equipment is actually the expensive one.
Platform: TNS · Energy
The problem
The electricity bill is visible; where it goes is not
Most plants know their monthly total and nothing below it. Without a per-machine number there is no way to tell an old compressor running all night from a press that is simply working hard, so efficiency programmes end up arguing from opinion.
Signs we usually find
- Energy use is known at plant level only, not per machine or line
- A jump in the bill is noticed only when the invoice arrives
- No baseline exists to compare similar machines against
- Consumption reports are still assembled by hand in spreadsheets
Used by
- Plant Manager
- Energy Manager / ISO 50001 team
- Maintenance & Utility Engineer
- Finance / Cost Control
Data it reads
- Three-phase or single-phase power meters per machine or panel
- Existing SCADA or PLC data where it is already available
- Shift schedules and production output, for energy per unit
How it works
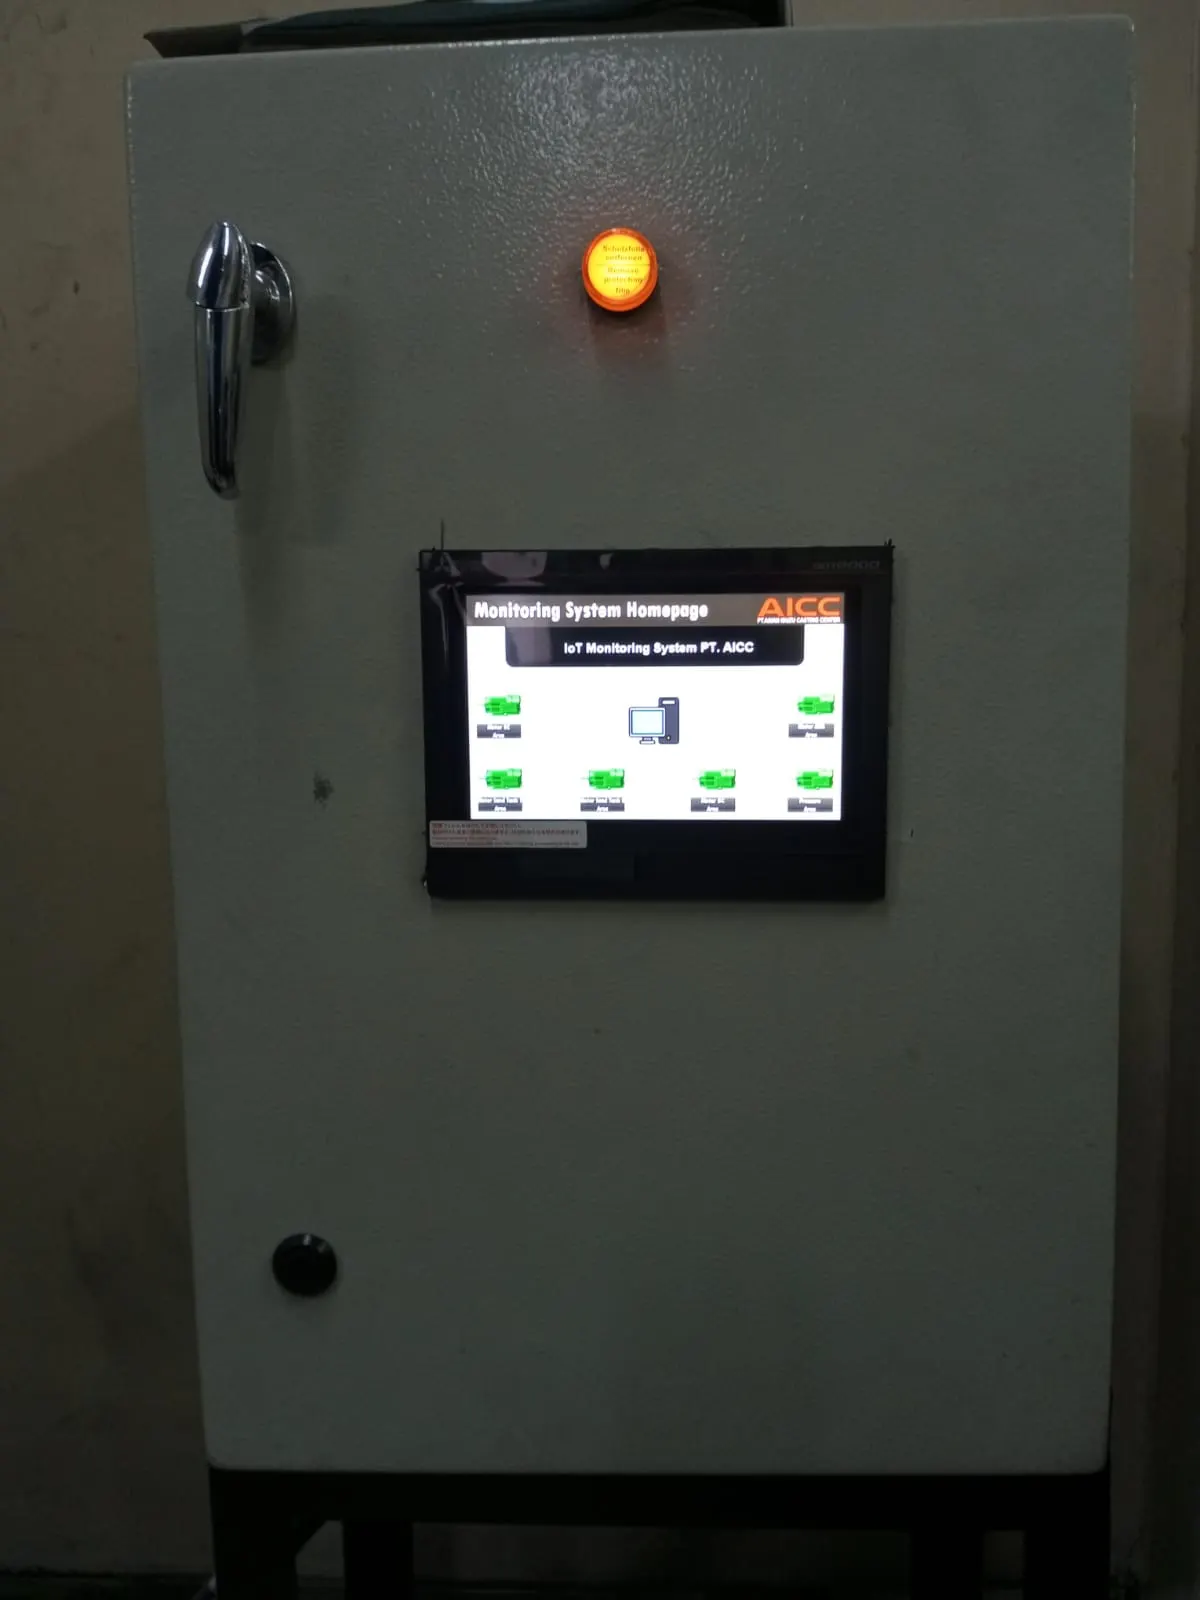
From the machine to a decision
01
Acquire
Meters & gateway at the machine panel
02
Normalise
kWh, kW, A, V, PF, frequency
03
Accumulate
Per machine, shift, day, month
04
Visualise
Live dashboard & trends
The system
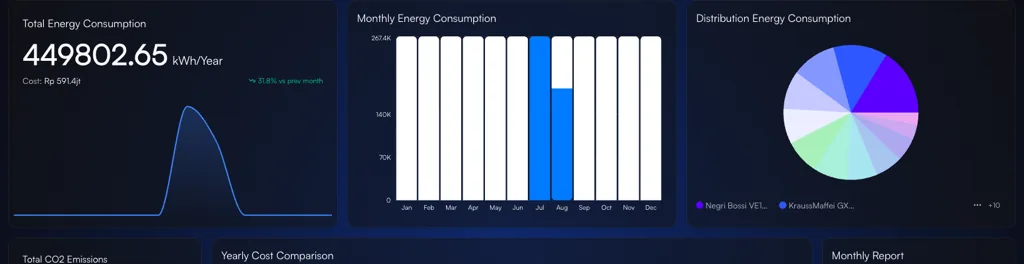
What it looks like on screen
Capabilities
What you can do with it
Consumption per machine
kWh and cost split by equipment, not just by plant.
Full electrical parameters
Voltage, current, power, and power factor per phase for power quality work.
Peak load & demand
See which machines and which hours build your peak.
Energy per unit of output
Consumption tied to production volume, so a rise or fall can be explained.
Historical trends
Day, month, and year comparisons without manual recaps.
CO₂ estimate
Electricity converted into an emissions figure for reporting.
Consumption breakdown
Each machine’s share of the plant total, visible at a glance.
Report export
Periodic reports in PDF and Excel for internal use and audits.
On the floor
How it is used day to day
01
Measure
Fit meters on the machines that matter
02
Collect
Data flows in on its own, no recaps
03
Compare
Across machines, shifts, and periods
04
Act
Go after the worst offenders first
Impact
Why it matters
01
A basis for efficiency decisions
Without per-machine data an efficiency programme is guesswork. Equipment-level consumption turns the discussion from assumption into a list you can rank.
02
Energy lands in the cost of production
Consumption tied to output lets energy cost be allocated to a product or a line instead of sitting in plant overhead.
03
Evidence for reporting and audit
Continuous, exportable data becomes the basis for energy and emissions reporting, certification included.
Start with this alone
Energy Monitoring can run on its own across a handful of critical machines, then grow into efficiency analysis, OEE, and production monitoring inside TNS as the need appears.
In practice
Across different kinds of plants
- Injection Moulding
- Compare machines of similar tonnage to find the unit that is out of line.
- Utility & Compressor
- Watch compressors and chillers that keep running outside production hours.
- Food & Beverage
- Separate process load from refrigeration load to get cost per batch.
- Multi-plant
- Compare energy intensity across plants using one measurement definition.
Integration
It connects to what you already have
No PLC, meter, or ERP needs replacing. Machvory reads from the equipment already installed in your plant.
01
PLCs, sensors, meters
Data at the machine
02
Edge gateway
Acquisition and buffering
03
Machvory integration layer
Modbus, OPC UA, MQTT
04
TNS / OPTIMUS
Analytics and workflow
05
ERP, SAP, BI
Enterprise reporting
- Siemens, Mitsubishi, Omron, Allen-Bradley PLCs
- Modbus TCP and Modbus RTU
- OPC UA
- MQTT
- Power and energy meters
- Vibration, temperature, current sensors
- Existing SCADA and HMI
- ERP and SAP
- REST API and SQL
Next steps
What usually comes next
Start with one need and add the rest when you actually need it.
FAQ
Questions we get a lot
Do we have to meter every machine at once?
No. The usual approach is to start with the largest loads or the utilities that run continuously, because that is where waste shows up first. Coverage widens once the early consumption patterns are readable.
What if the plant already has power meters?
Meters already installed can be read directly as long as they speak Modbus or another open protocol, so nothing needs replacing.
Do we have to replace our existing PLCs or machines?
No. Machvory reads from what is already installed over Modbus, OPC UA, MQTT, or a power meter. Where a machine does not expose the data point we need, we add a sensor or gateway to that machine alone rather than touching its controls.
Can it run on-premise, with no cloud?
Yes. It can run entirely on a server inside the plant, in the cloud, or split between the two. The choice usually comes down to your IT/OT policy and what the plant network can carry.
How long does the first implementation take?
It depends on how ready the data points are and how many machines are involved. We normally start with a pilot on one line or a few critical assets to prove out data quality and the workflow, then widen once it holds up on the floor.
Audit Your Machine Energy Use
Our engineers look at your machines and the data you already have, then scope a pilot that is realistic to run.
- No obligation to buy
- A reply within business hours
- WhatsApp works too