
Production & energy performance
TNS
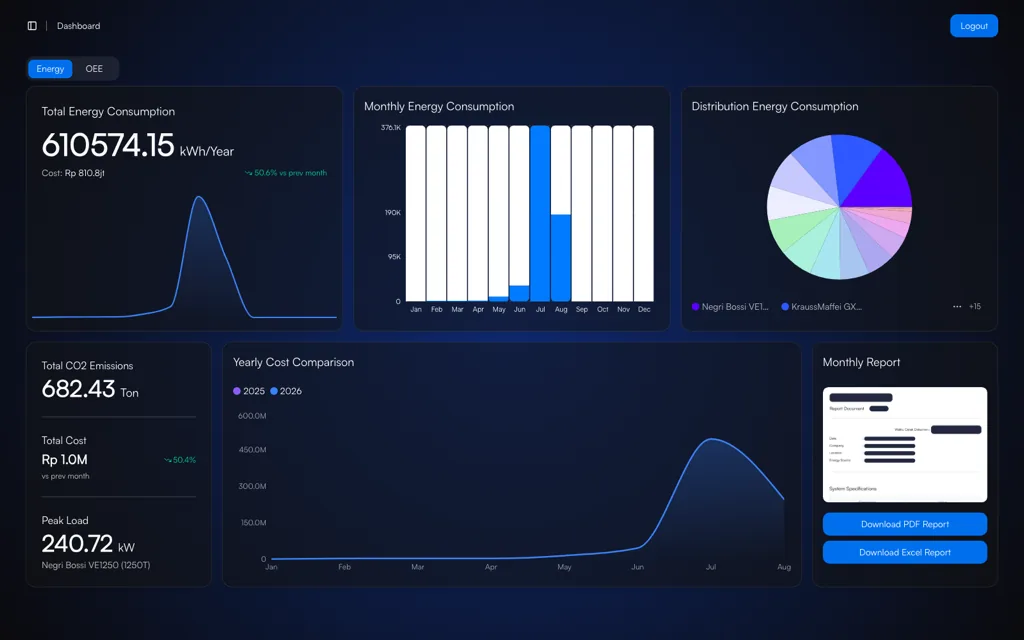
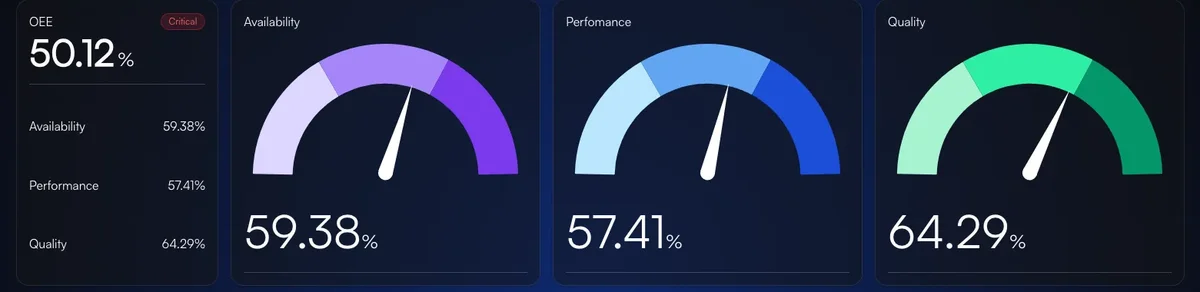
Are the machines running productively and efficiently?
- Automatic OEE per machine and per shift
- Downtime recorded with its cause
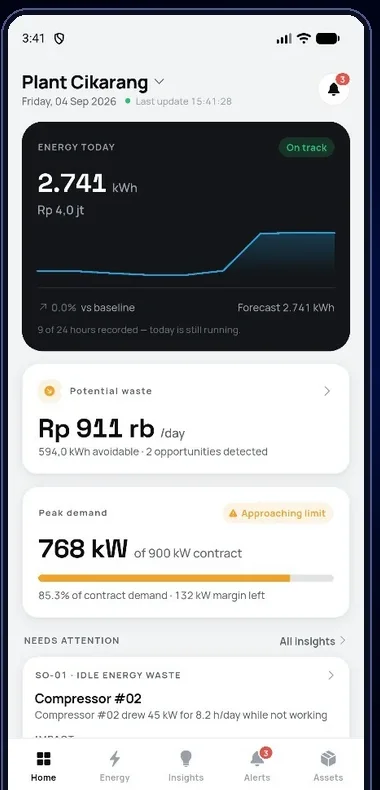
- Energy use per machine and per unit of output
- Android and iOS app for energy findings

Industrial IoT · CMMS · Digital Twin
Machvory connects the machines, sensors, and power meters in your plant to one system: condition and energy monitoring, OEE, and maintenance work orders. Fitted to the machines you already run, without replacing a single PLC.
Trusted on engineering and industrial projects









Start from the problem
Pick the one closest to your situation. Each row leads to a page that covers it in detail, screens included.
The electricity bill keeps rising, and nobody knows which machine is behind it.
Measure consumption per machine, find the waste, and track energy per unit of output.
Output targets slip, and the reason depends on who you ask.
OEE calculated automatically per machine and shift, with the causes of downtime.
A critical machine failed, though the signs were there weeks before.
Vibration, temperature, and current watched continuously; condition changes are flagged early.
Work orders live on paper or in WhatsApp groups, and repair history is hard to find.
Schedules, work orders, checksheets, spare parts, and repair history in one system.
Operators report a problem, but the technician arrives late.
A call from the line reaches the right technician directly, and response time is recorded.
Management wants to see the plant without opening ten reports.
A 3D model of the plant with the status, alarms, and work orders of every asset.
Two platforms
TNS and OPTIMUS read the same assets and the same data. What differs is the question each one answers.
Production & energy performance
Are the machines running productively and efficiently?
Asset reliability & CMMS
Which machine is most at risk, and what needs doing?
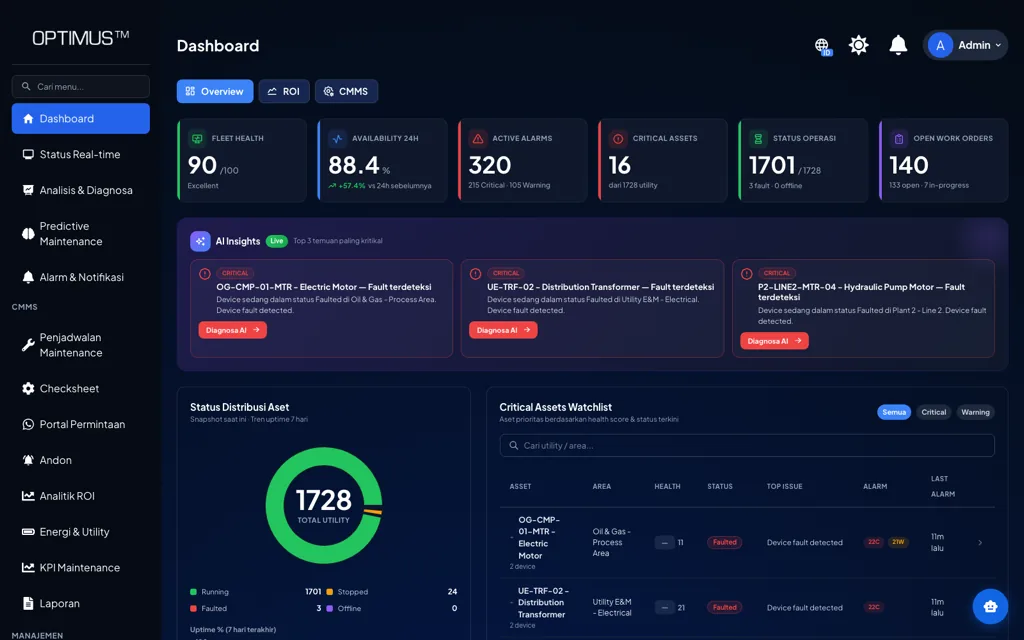
Ready-to-install package
Advantech wireless sensors on your critical machines, a short maintenance decision list every morning, work orders with proof the repair worked, and an AI assistant, in one package priced per sensor point. A good way to start with a few critical assets.
See the package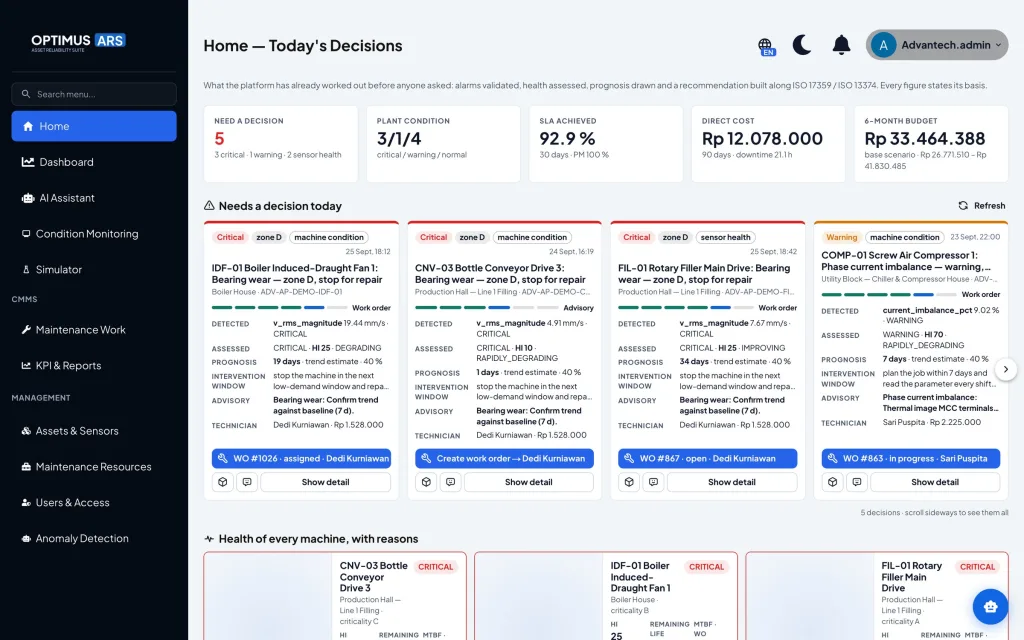
Digital Twin
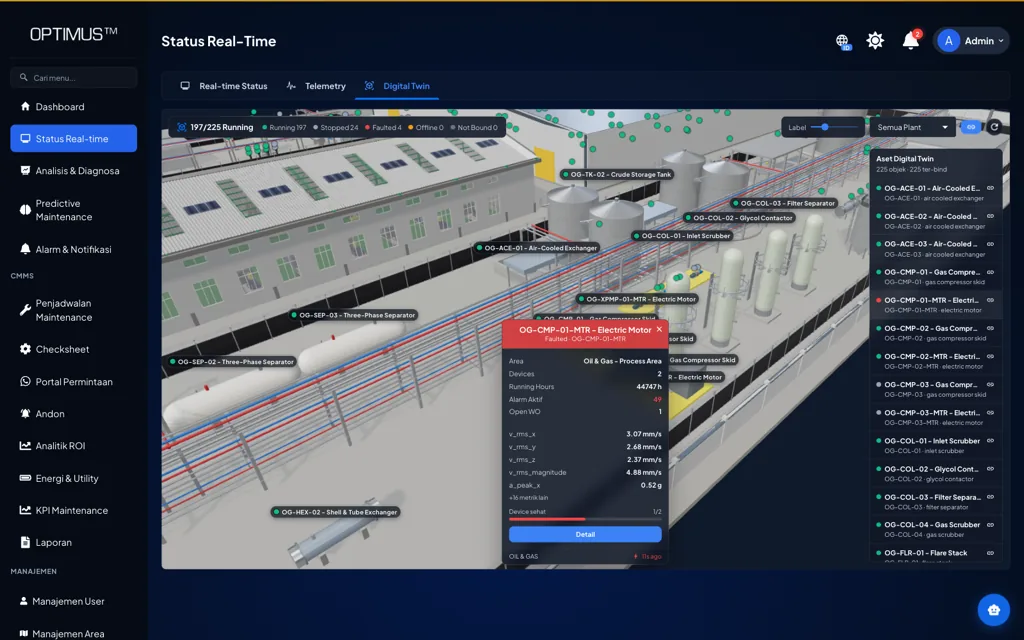
A 3D model of the plant carrying machine condition, production, energy, alarms, and work orders. Operating status reads straight off the physical asset instead of a wall of tables.
01
Where every asset sits on the plant model, and how it is doing.
02
Condition, alarms, history, and analytics attached to the same asset.
03
From an alarm straight to an inspection, a work order, and the repair.
In the field
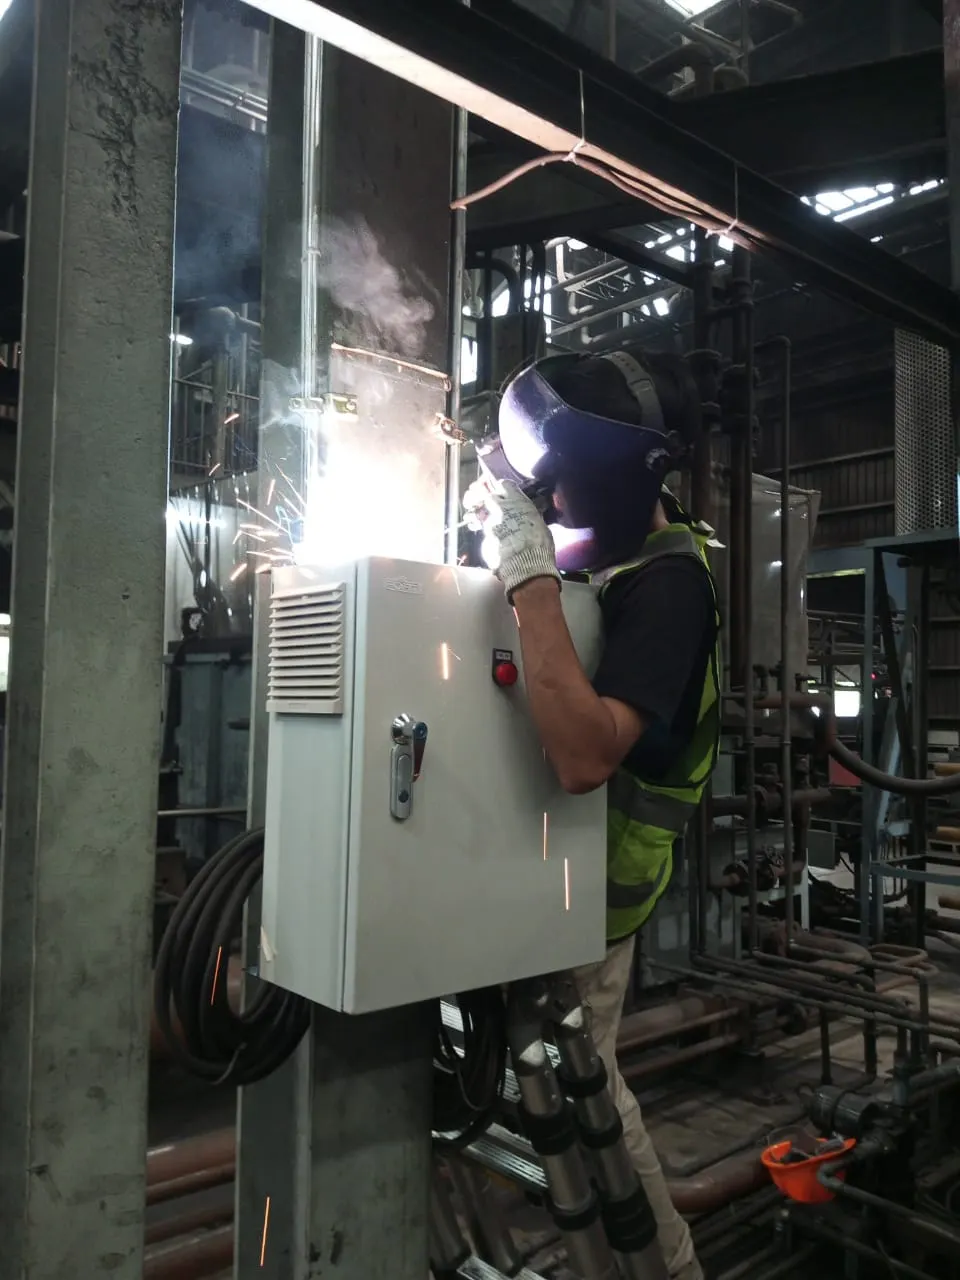
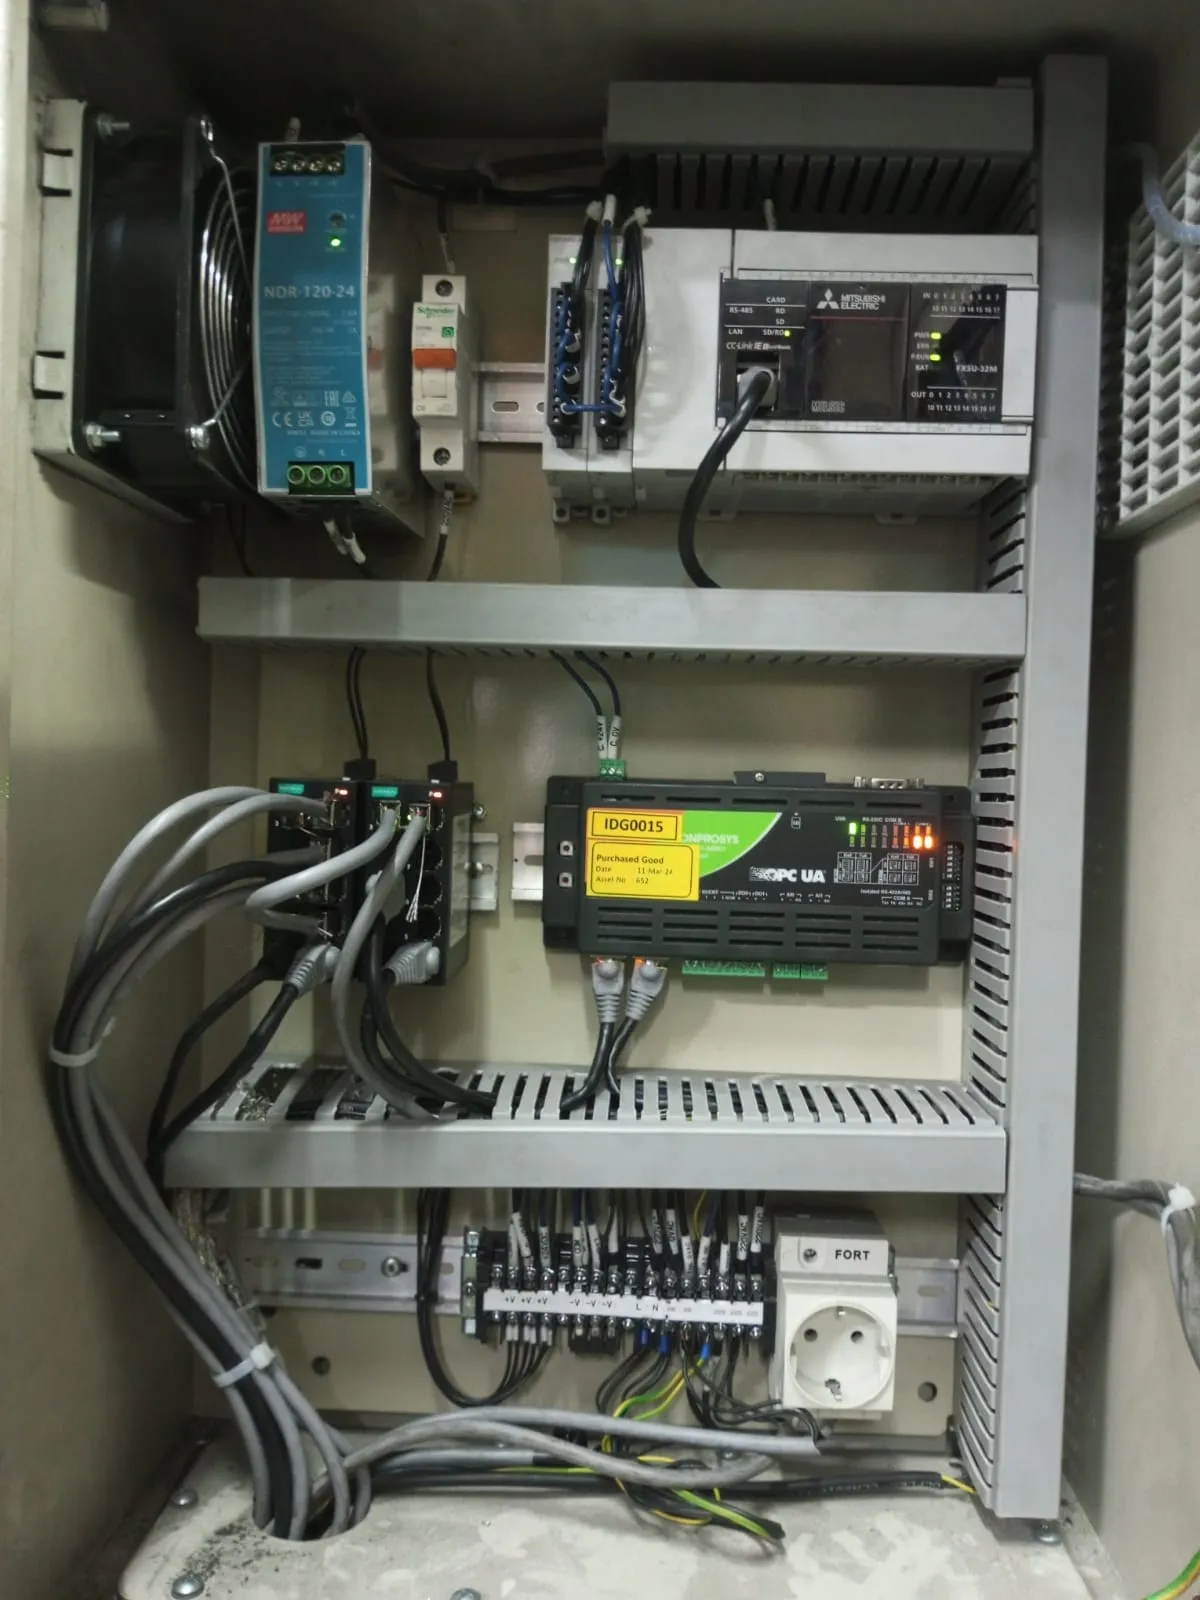
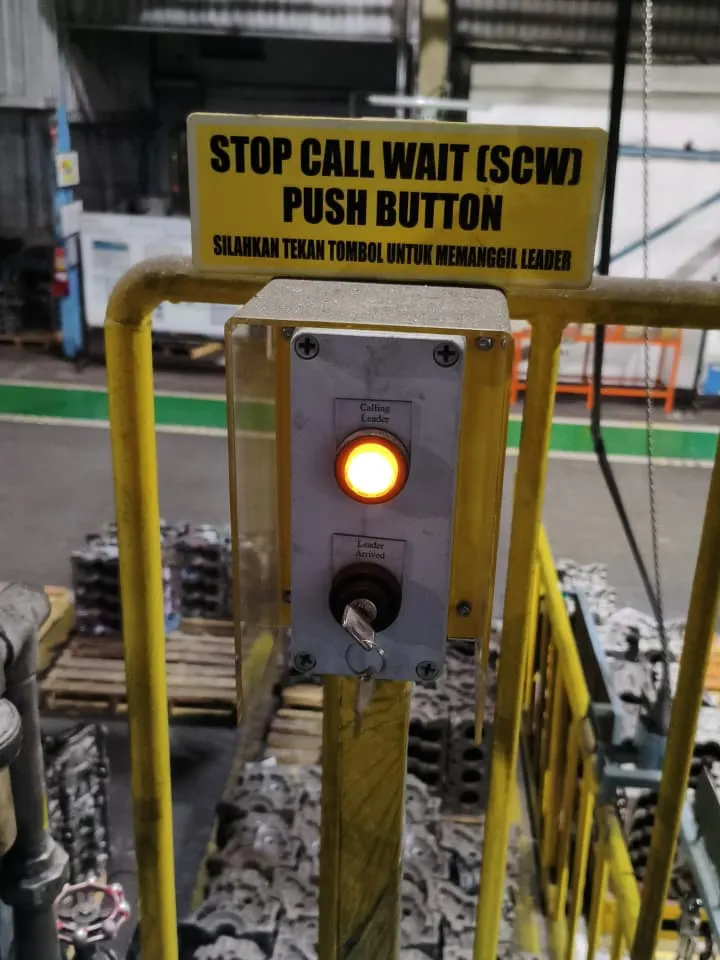
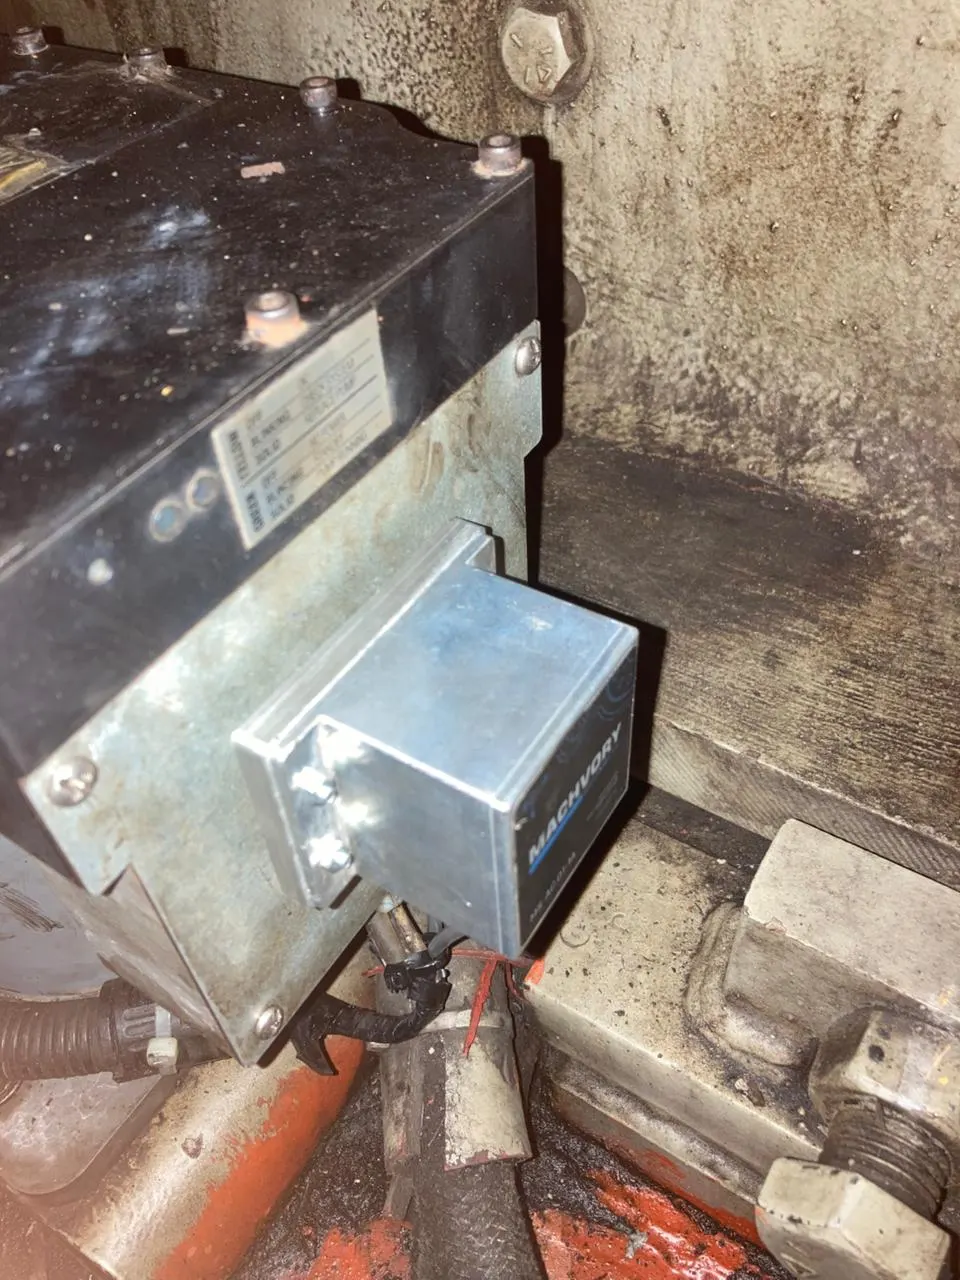
Our own team goes onto the production floor: mounting sensors and panels, pulling cable, setting up the network, until the dashboard is live on the operator’s screen. These photos are from our own projects.
Case studies
A summary of five deployments. Outcomes are written as they are, with no percentages we cannot yet prove.
Transportation · OPTIMUS
Generator condition is watched continuously, so signs of trouble show up before the machine quits.
PT Kereta Api Indonesia
Metal casting · OPTIMUS
Maintenance is scheduled from asset condition, with clear priorities for the team.
PT Asian Isuzu Casting Center
Precision machining · OPTIMUS
Repair cost and loss avoided are recorded on every work order.
PT YPTI
Manufacturing · TNS
Energy use is visible per machine and area, including abnormal spikes.
PT Armeta Kreasi Mandiri
Plastics manufacturing · TNS
Every machine’s status reads off a 3D model, with productivity and downtime.
PT Dharma Poly Plast
How we work
Projects start on one line or a few critical assets. Once the results hold up on the floor, the scope widens.
01
Understand
Which operating problem costs the most today
02
Check the data
Measuring points that exist, and those to add
03
Pilot
One line or a few critical assets
04
Integrate
Connect PLCs, meters, and existing systems
05
Validate
Results verified with the team on the floor
06
Scale
More machines, areas, or capabilities
Why Machvory
01
We work from the physical layer up to the analytics, so data quality problems get fixed at the source, not patched in a dashboard.
02
Your PLCs, machines, meters, and ERP stay. We read from what is already installed.
03
Deployed to fit your IT/OT policy, including running entirely inside the plant network.
04
Our engineers work in Indonesian and English, know how plants here run, and can come on site.
Integration
No PLC, machine, meter, or ERP needs replacing. We read data from the equipment already installed, and only add sensors where a data point is missing.
The gateways and sensors we design are the connectivity layer that brings the platform to life. They are not a hardware catalog sold on their own.
FAQ
TNS answers whether machines run productively and efficiently: OEE, downtime, production, and energy. OPTIMUS answers which machine is at risk and what to do about it: condition monitoring, asset health, and CMMS. Each works on its own or together, on the same data.
No. We read data over Modbus, OPC UA, MQTT, or from power meters on the equipment already installed. Where a machine lacks a data point we need, we add a sensor or gateway to that machine alone, without touching its controls.
Yes. It can run entirely on a server inside the plant, in the cloud, or split between the two. The choice usually follows your IT/OT policy and the network on site.
It depends on how ready the data points are and how many machines are involved. We usually start with a pilot on one line or a few critical assets to prove the data and the workflow, then widen once the results hold up.
The devices we design are part of the solution, not a catalog sold separately. For a ready-to-install package with wireless sensors, there is OPTIMUS ARS with Advantech.
Manufacturing, automotive, food and beverage, metal casting, process industries, and transport facilities. What matters is the kind of machines and the data available, not the industry name.
Our engineers will help you pick a sensible first step: which machines first, what data already exists, and how big a pilot is reasonable.