
TNS · ENERGY EFFICIENCY
Find the waste, then prove the saving
Energy monitoring gives you visibility. Energy efficiency turns that data into a ranked list of waste, the fix for each one, and a check on whether the fix actually worked.
Platform: TNS · Energy
The problem
The energy data exists, but nothing changes because of it
Plenty of plants already collect consumption data and stop at the dashboard. There is no baseline, no split between productive and idle draw, and no way to show that a fix actually saved anything.
Signs we usually find
- Machines still pull serious power when nothing is being produced
- No like-for-like comparison between similar machines
- Savings claims cannot be backed up with data
- The efficiency programme dies after the first report
Used by
- Energy Manager
- Continuous Improvement / Lean Team
- Plant Manager
- ISO 50001 team
Data it reads
- Continuous per-machine consumption from Energy Monitoring
- Machine state: running, idle, stopped
- Production output per shift, to work out energy intensity
How it works
From the machine to a decision
01
Measure
Consumption per machine
02
Compare
Across machines & periods
03
Identify
Idle & excess draw
04
Prioritise
Rank by impact
05
Verify
Baseline before & after
The system
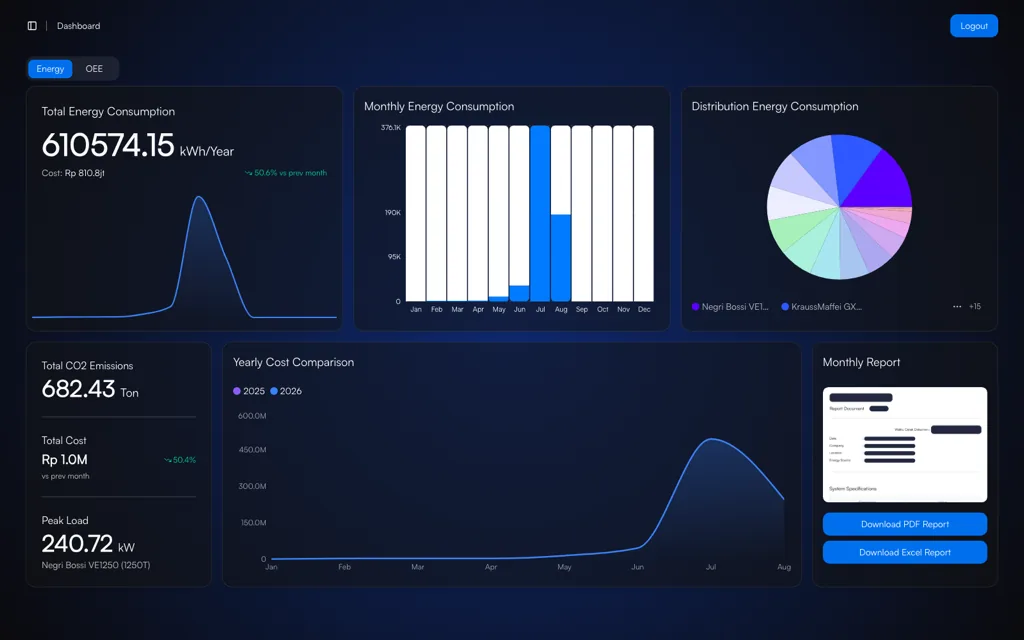
What it looks like on screen
Capabilities
What you can do with it
Idle consumption
Power drawn while nothing is produced, split out from productive draw.
Machine benchmarking
Similar machines compared on the same basis, so the outlier stands out.
Energy intensity
kWh per unit of output, an indicator production volume cannot distort.
Baseline & verification
Before and after a fix, compared on identical definitions.
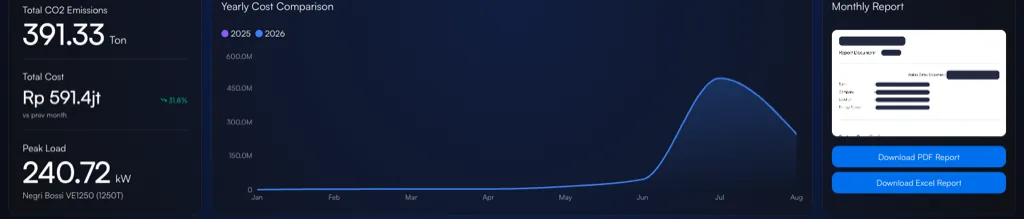
Cost across periods
This year’s energy cost against last year’s, month by month.
Peak load analysis
Know what builds the peak, so load can be rescheduled.
Ranked fixes
Findings ordered by impact rather than by the order you found them.
Emissions trail
A change in consumption flows straight through to the CO₂ estimate.
On the floor
How it is used day to day
01
Anomaly spotted
Consumption off pattern
02
Analyse
Idle, load, or process
03
Fix it
Settings, scheduling, or maintenance
04
Verify
Compare against the baseline
Impact
Why it matters
01
An efficiency programme that does not end at the report
Every finding gets an owner, an action, and a verification. A fix that changed nothing in the data shows up as such instead of being assumed to have worked.
02
Savings you can defend
Claims are verified against the same measurement baseline, so the number survives a budget conversation.
03
Support for an energy management system
The measure-compare-verify loop lines up with the continuous improvement cycle energy management standards ask for.
Start with this alone
Efficiency analysis can start on the machines that already have meters. When the focus widens to productivity, the TNS OEE and downtime modules use the same data and the same asset structure.
In practice
Across different kinds of plants
- Injection Moulding
- Catch machines still drawing heavily while waiting on a mould change.
- Utility
- Re-measure compressor draw after an air leak has been repaired.
- Automotive
- Compare energy intensity between shifts on the same line.
- Process Industry
- Verify what a change in process settings did to consumption.
Integration
It connects to what you already have
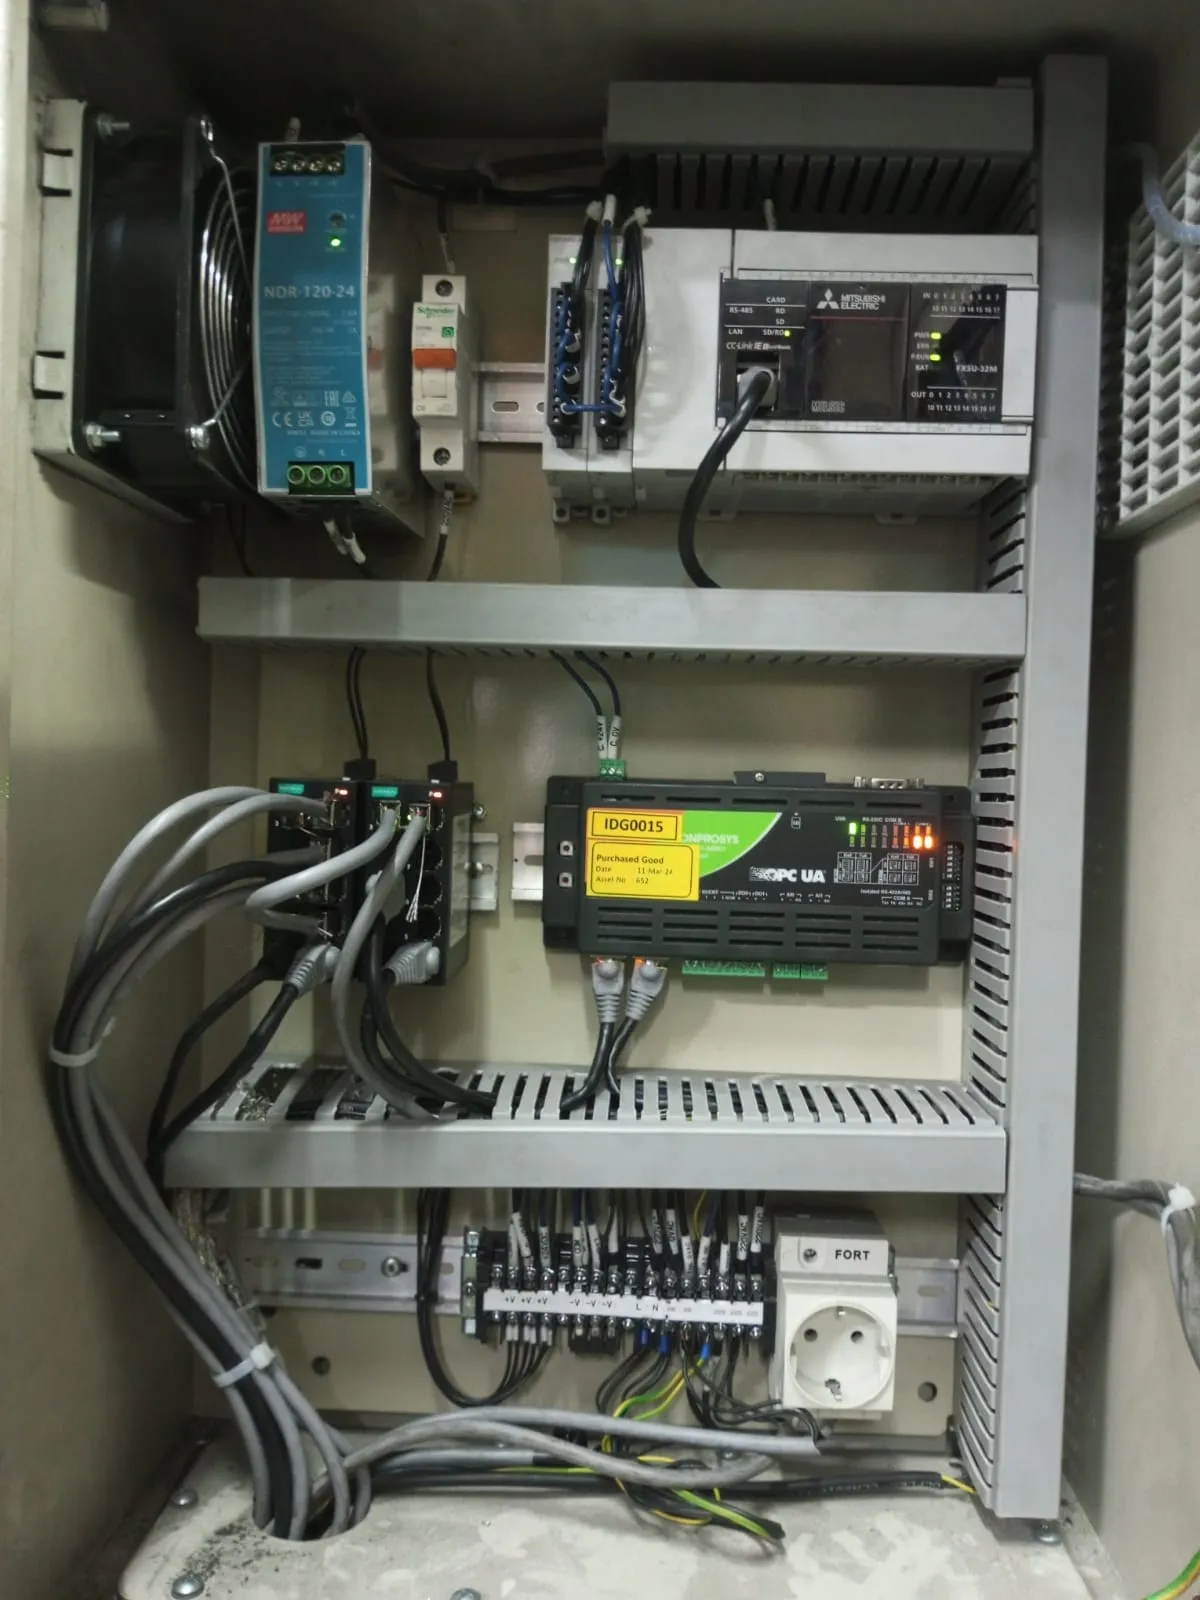
No PLC, meter, or ERP needs replacing. Machvory reads from the equipment already installed in your plant.
01
PLCs, sensors, meters
Data at the machine
02
Edge gateway
Acquisition and buffering
03
Machvory integration layer
Modbus, OPC UA, MQTT
04
TNS / OPTIMUS
Analytics and workflow
05
ERP, SAP, BI
Enterprise reporting
- Siemens, Mitsubishi, Omron, Allen-Bradley PLCs
- Modbus TCP and Modbus RTU
- OPC UA
- MQTT
- Power and energy meters
- Vibration, temperature, current sensors
- Existing SCADA and HMI
- ERP and SAP
- REST API and SQL
Next steps
What usually comes next
Start with one need and add the rest when you actually need it.
FAQ
Questions we get a lot
How is this different from Energy Monitoring?
Energy Monitoring answers "how much are we using". Energy Efficiency answers "which part is wasteful, why, and did the fix work". Same data source, different purpose and different output.
Can we use it without production data?
Yes, but only so far. Without output figures the analysis stops at absolute consumption and idle draw. Energy per unit only becomes calculable once production data is available, whether from a counter sensor or from work order entries.
Do we have to replace our existing PLCs or machines?
No. Machvory reads from what is already installed over Modbus, OPC UA, MQTT, or a power meter. Where a machine does not expose the data point we need, we add a sensor or gateway to that machine alone rather than touching its controls.
Can it run on-premise, with no cloud?
Yes. It can run entirely on a server inside the plant, in the cloud, or split between the two. The choice usually comes down to your IT/OT policy and what the plant network can carry.
How long does the first implementation take?
It depends on how ready the data points are and how many machines are involved. We normally start with a pilot on one line or a few critical assets to prove out data quality and the workflow, then widen once it holds up on the floor.
Check Where Your Energy Is Going
Our engineers look at your machines and the data you already have, then scope a pilot that is realistic to run.
- No obligation to buy
- A reply within business hours
- WhatsApp works too