
Energy
How to cut electricity use in a factory: from the bill to the machine
The factory electricity bill went up again this month, and the management meeting asked everyone to save. The office lights now go off earlier, while the compressor keeps running all Sunday to feed leaks nobody has looked for. This article sets out a way to cut electricity use that starts by reading the bill and ends at the machines that actually use the energy.
Key takeaways
- Cutting electricity use in a factory means removing energy that produces no output. The measure is factory energy efficiency, that is kWh per unit of output, not the total bill.
- A factory electricity bill carries several different levers: kWh in peak (WBP) and off-peak (LWBP) periods, excess reactive energy (kVArh), and charges tied to connected capacity. Each one comes down in a different way.
- Waste is usually spread across machines running unloaded, compressed air leaks and pressure set too high, pumps and fans throttled by valves, and HVAC and chiller settings.
- Savings are verified against a baseline normalized for production, not by comparing this month’s bill with last month’s.
What cutting electricity use in a factory means
How to cut electricity use in a factory in a way that lasts rarely starts with switching off the office lights. It starts with a simpler question that is harder to answer: what is the energy paid for each month actually used for. Cutting electricity use here means removing energy that produces nothing, such as a motor spinning without load, compressed air leaking away, or a pump working against its own valve, without reducing output, quality, or safety.
That is why it is more accurate to talk about factory energy efficiency, the energy used for each unit of output. A plant whose production rises may well pay a larger bill and still become more efficient. ISO 50001 uses the term energy performance for this, meaning measurable results related to energy efficiency, energy use, and energy consumption, and places it in a cycle of continual improvement: plan, do, check, act[1].
This article focuses on action: reading the bill, finding the sources of waste, fixing them, and then proving the result. Electrical parameters, the sub-metering hierarchy, and how to read load profiles are covered in detail in the article on factory energy monitoring.
Read the factory electricity bill first
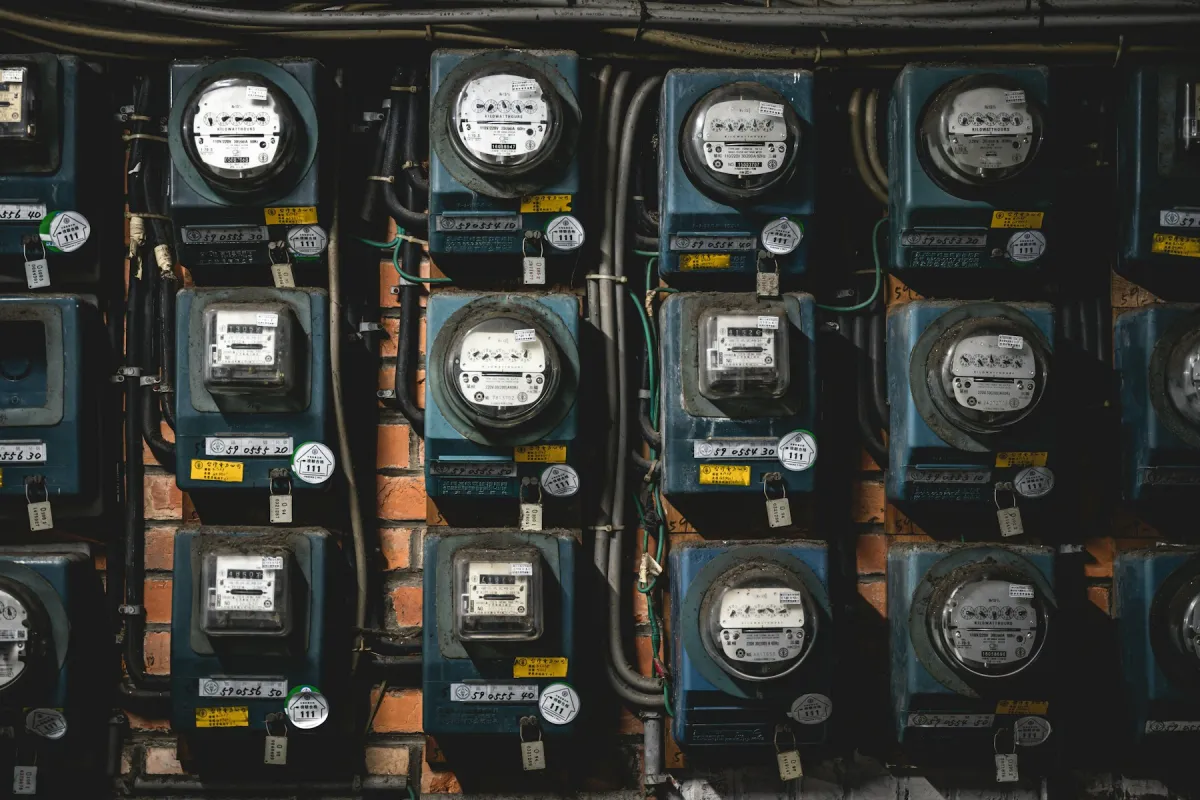
The factory electricity bill is the first energy data every plant already has, and it is often read for the total alone. Yet its breakdown shows where savings should be aimed. For industrial customers of PLN, the Indonesian state utility, the structure of the bill depends on the tariff class, but it generally contains the following components.
- Energy use (kWh). In certain tariff classes, consumption is recorded separately for the peak load period (WBP, waktu beban puncak) and the off-peak period (LWBP, luar waktu beban puncak), at different prices. The same number of kWh can cost different amounts depending on when the energy is used.
- Excess reactive energy (kVArh). This charge appears when the customer’s average power factor falls below the limit set in the tariff rules.
- Charges tied to connected capacity. Some tariff rules link part of the bill to the contracted capacity in kVA, regardless of how much energy is actually used. A contract far above what the plant needs, or one cut too close to the peak load, both deserve a review.
- Taxes and other charges. These follow the size of the bill, so they come down when the components above come down.
Each component has a different lever. kWh falls when equipment uses less energy for the same work. The peak period charge falls when loads with flexible schedules move outside peak hours, even though their kWh stays the same. The kVArh charge falls when power factor is corrected, often without changing kWh at all. Peak load (kW or kVA) does not always appear as a line of its own, but it determines how much connected capacity and transformer capacity must be provided.
What is a reasonable factory electricity bill?
This question comes up often, and the answer cannot be a single number. The bill depends on the tariff class, the connected capacity, the number of kWh, the split between peak and off-peak periods, and the power factor. Two plants with the same bill can differ widely in efficiency if their products differ. The useful comparison is not another plant’s bill but your own, divided by output: rupiah per unit and kWh per unit, month by month.
Also work out the average price per kWh, that is total rupiah divided by total kWh, from your own bill. This is the figure to use when judging every proposed saving, not a figure from another plant or a brochure. Tariff class, peak hours, price per kWh, and the power factor limit are set by the tariff rules in force and can change, so always read them from your own plant’s bill and contract.
Measure before you cut
The bill shows how much, but not where. Before choosing an action, a plant needs to know which energy uses are the largest. ISO 50001 calls them significant energy uses (SEU): uses that account for a large share of consumption or that offer a large potential for improvement[1]. In many plants the list looks similar: air compressors, chillers and cooling systems, large pumps and fans, machines with heaters such as injection molding machines and ovens, and lighting in large buildings.
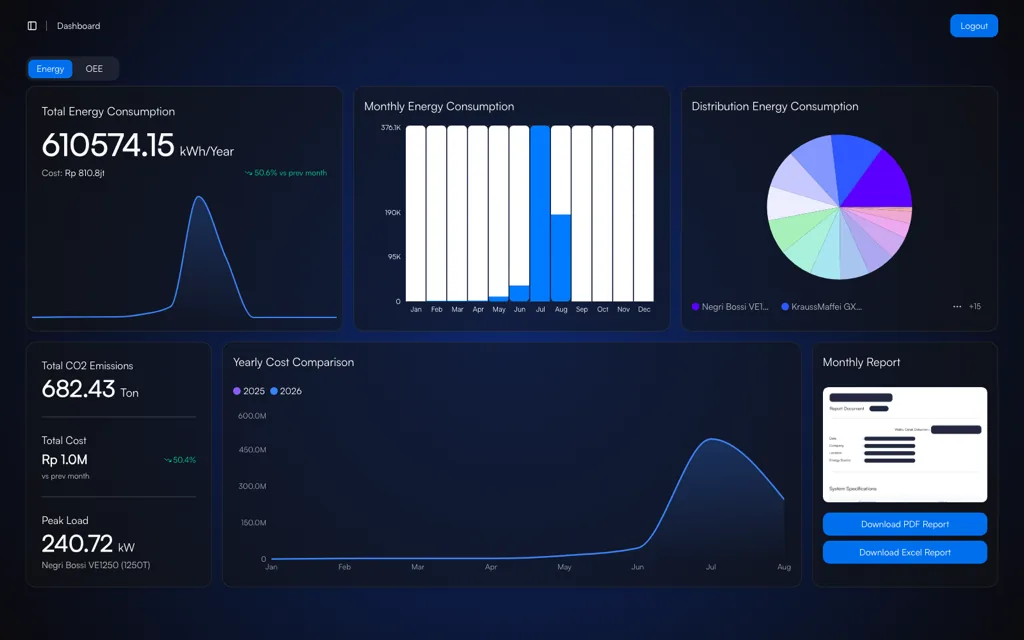
The way to find them is sub-metering: meters on the main panel, area panels, and the feeders of large machines, so that consumption can be broken down by place and time. At the start, not every point needs a permanent meter. A portable power analyzer left on a compressor or chiller for one to two weeks is enough to see its load pattern, including how long the machine runs without doing useful work.
Consumption figures only mean something once they are tied to output. ISO 50006 provides the framework for this through the energy performance indicator (EnPI) and the energy baseline, a reference from one period against which later periods are compared[2]. The most common form of EnPI in a factory is the ratio of energy to output.
Output based energy performance indicator
EnPI = energy consumed (kWh) ÷ quantity of output
Output in a unit relevant to the same measurement boundary: units, tonnes, meters, or liters of good product.
Energy and output are taken from the same period and the same boundary, for example one line over one month.
This simple ratio has a weakness. When a line carries a large base load, its EnPI falls by itself as volume rises, even though nothing has been improved. ISO 50006 therefore also covers model based EnPIs that account for relevant variables such as production volume or ambient temperature[2]. To get started, the ratio is enough, as long as its limits are kept in mind when reading it.
Where factories waste the most electricity
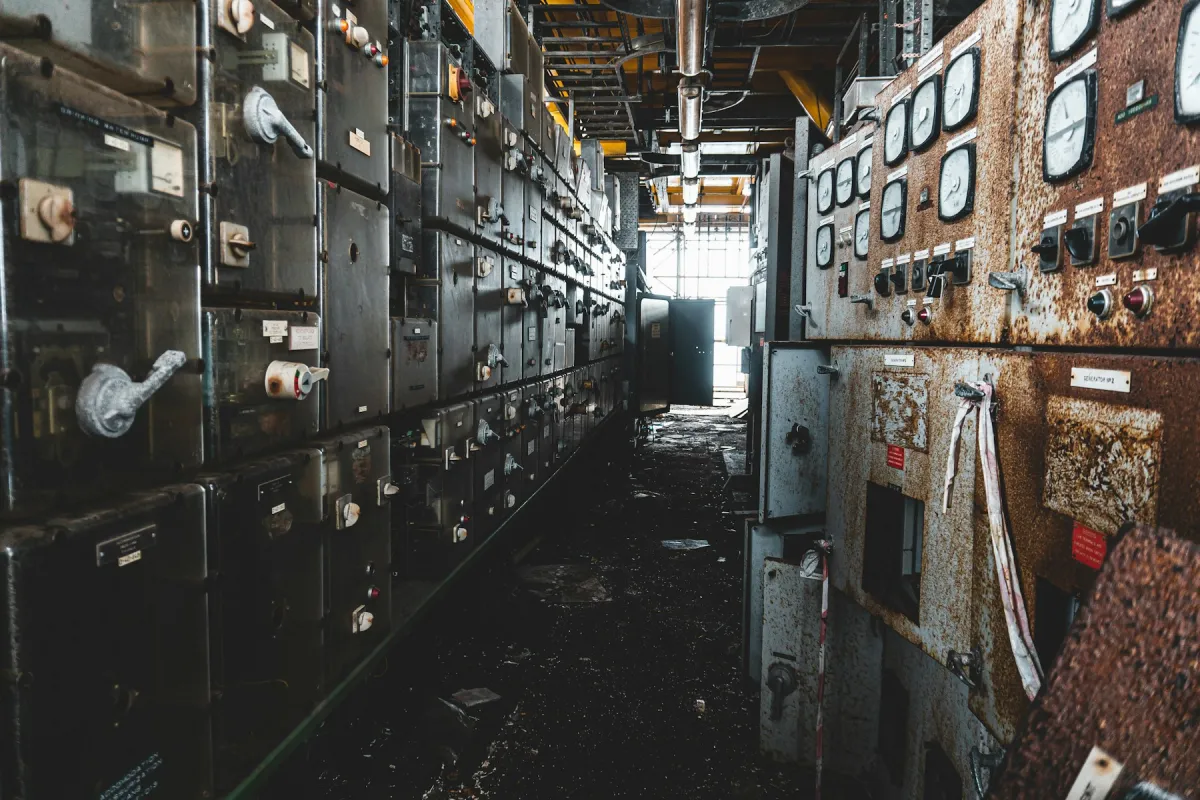
Electricity waste in a factory seldom comes from one large, obvious source. More often it is spread across habits and settings that have long been treated as normal: a compressor that keeps working on Sunday, a pump valve left half closed since commissioning, or a chiller setpoint lowered in the dry season and never put back. The table below summarizes the sources found most often, the signs to look for, and the usual actions.
| Source of waste | Signs | Action |
|---|---|---|
| Machines running unloaded | Power stays high when nothing is being produced; conveyors, hydraulic units, or barrel heaters stay on during breaks and weekends | A clear shutdown procedure, idle timers or interlocks, a reheating schedule before the shift |
| Compressed air leaks | The compressor keeps loading and unloading when there is no demand; hissing at joints, hoses, and fittings | Regular leak surveys with an ultrasonic detector, tag every finding, repair through work orders |
| Compressed air pressure set too high | Setpoint raised to answer a complaint from one machine; large pressure drop across filters and piping | Lower it in steps to what critical users need; fix the causes of pressure drop |
| Pumps and fans controlled by valves or dampers | Discharge valve permanently half closed, dampers rarely fully open, bypass flow | Evaluate VSDs for variable loads, impeller trimming, or a correctly sized pump |
| Lighting | Lights on in empty areas or in daylight; old high wattage fittings | Switching zones, occupancy or daylight sensors, replacement with LED along with the maintenance schedule |
| HVAC and chillers | Setpoint colder than the process needs; a large chiller running at low load; dirty condenser | Review setpoints, clean heat exchangers, set the chiller operating sequence |
| Low power factor | kVArh charges on the bill; capacitor bank steps dead or fuses blown | Inspect and maintain the capacitor bank, measure power factor per panel |
| Peak load from simultaneous starts | Demand spikes at the start of a shift; the peak falls in the WBP period | Staggered start sequence, move flexible loads outside peak hours |
Actions are chosen after measurement. Not every row applies in every plant, and some actions need their effect on quality and safety assessed first.
The easiest pattern to look for is load when nothing is being produced. Look at the plant’s power on a night without a shift or on a holiday. Some of it is needed, such as warehouse cooling and security systems. The rest is habit: conveyors that keep running through breaks, hydraulic units that stay pressurized, or injection molding machines whose barrels are kept hot all weekend. Switching these loads off costs almost nothing, but it needs a clear procedure: who switches off, when to switch back on, and how long the reheat takes so that the first parts still meet quality.
Lighting and HVAC belong to the same group: settings and schedules are more often the problem than the equipment. Lights on in empty areas, room setpoints colder than the process needs, and dirty chiller condensers are common findings on a walk-through. Replacing lamps with LED makes sense, but it is usually cheaper when done in stages along with the maintenance schedule.
Power factor and peak load
Induction motors and transformers need reactive power to build their magnetic fields. This power does no work, but its current still flows through cables and transformers. A motor loaded far below its rating runs at a lower power factor[3], so a plant with many oversized motors tends to have a low power factor and can incur kVArh charges. A capacitor bank is the usual answer, but an installed capacitor bank also needs checking. Dead steps, worn contactors, or blown fuses mean the compensation no longer works as it did when it was installed.
Peak load is a separate matter. The peak often forms at the start of a shift, when many large motors and heaters are switched on at almost the same time. Staggering the start sequence does not reduce kWh, but it lowers the peak and can postpone the need to increase connected capacity. Loads with flexible schedules, such as filling water tanks or batch processes not tied to a delivery schedule, can be moved outside the WBP period.
Motors, pumps, and fans
Electric motors drive almost everything that turns in a factory, so motor systems usually take a large share of industrial electricity use. The U.S. Department of Energy (DOE) sourcebook on motor systems stresses that efficiency is set by the system as a whole: the motor, the drive, the transmission, the driven equipment, and the way flow is controlled[3]. An efficient motor in a wasteful system still makes a wasteful system.
The most common example is a centrifugal pump or fan whose flow is controlled with a valve or damper. The motor keeps turning at full speed, and part of its energy is then thrown away as pressure loss across the valve. On centrifugal loads, the power required falls steeply as speed is reduced, following the affinity laws, so controlling flow with a variable speed drive (VSD) is often far more economical for loads whose flow varies[3]. The condition is that the load really does vary. A pump that works at the same operating point all day gains little from a VSD; in that case, trimming the impeller or fitting a correctly sized pump may make more sense.
A motor that is too large for its load is another common finding. A motor working far below its rating runs at lower efficiency, in addition to its lower power factor[3]. Measuring a motor’s current and power in normal operation is an inexpensive way to find out how heavily it is really loaded.
Motor efficiency classes IE1 to IE4
IEC 60034-30-1 groups the efficiency of line operated AC motors into IE classes: IE1 (standard efficiency), IE2 (high), IE3 (premium), and IE4 (super premium)[4]. The higher the class, the smaller the motor’s losses for the same output power. The standard sets the minimum efficiency for each class by rated power, number of poles, and frequency, but it does not say which class a plant must buy.
In practice, the decision to move to a higher class is easiest at three moments: when a motor fails and the choice is between rewinding and buying new, when a new machine is being specified, and when a motor runs for most of the year so that the difference in losses accumulates. A high efficiency motor fitted to a valve controlled pump still wastes energy across the valve. So the order is to fix the system first, then choose the motor.
Compressed air: leaks and pressure set too high
Compressed air is among the most expensive forms of energy in a plant, because most of the electrical energy going into a compressor turns into heat and only a small part arrives as work at the point of use[5]. The DOE sourcebook on compressed air systems identifies leaks as a significant source of wasted energy[5]. Leaks also lower system pressure, and that drop is often answered by raising the compressor setpoint.
This is where the loop closes. Higher pressure makes the compressor work harder, increases the leak rate, and makes unregulated uses consume more air as well[5]. Inappropriate uses, such as blowing dust off clothing, cooling a work area, or open hoses for cleaning machines, add to the same load. Pressure should be lowered in steps while watching the most sensitive users, because one machine short of pressure quickly becomes the reason to raise it again.
Worked example: what a leak costs
The same sourcebook describes a simple way to estimate leakage on a compressor with load and unload control: run the compressor when there is no air demand at all, then record how long it spends loaded and unloaded[5]. Because there are no users, the compressed air only feeds the leaks. Leakage as a share of compressor capacity is the loaded time multiplied by 100, divided by the sum of loaded and unloaded time.
The figures below are illustrative, not data from any particular plant. On a Sunday, every machine is stopped but the air system stays pressurized. A compressor drawing 75 kW when loaded is seen to load for 20 seconds, then unload for 40 seconds, repeatedly. The system is pressurized for about 6,000 hours a year, and the average electricity price is assumed to be IDR 1,500 per kWh.
| Step | Calculation | Result |
|---|---|---|
| Leakage share | 20 × 100 ÷ (20 + 40) | 33.3% of compressor capacity |
| Average power feeding leaks | 75 kW × 20 ÷ 60 | 25 kW |
| Energy per year | 25 kW × 6,000 hours | 150,000 kWh |
| Cost per year | 150,000 kWh × IDR 1,500 | IDR 225,000,000 |
The price of IDR 1,500 per kWh is illustrative only, not a tariff. Use the average price from your own plant’s bill.
This calculation is deliberately simplified. It ignores the power the compressor still draws when unloaded, so the real cost tends to be higher, and it assumes the leak rate on Sunday is the same as on a working day. For a compressor with a VSD the method differs: measure the compressor’s power when there is no demand. What matters in this example is the sequence. The leak figure is turned into kWh, then into rupiah, so that the cost of surveying and repairing can be compared with the value of the energy being lost.
How to cut electricity use in a factory in the first 90 days
A factory energy efficiency program does not have to start with investment. The sequence below puts measurement and inexpensive fixes first, then uses the results to decide on projects that need a budget.
- Collect the last twelve months of bills. Separate peak and off-peak kWh, kVArh charges, and other components. Work out the average price per kWh and the kWh per unit of output for each month.
- Appoint an owner. One person responsible for the energy program, with representatives from production, maintenance, and utilities. Without an owner, findings stop at the report.
- Measure the largest energy uses. Fit meters or a portable power analyzer on compressors, chillers, and large motors for one to two weeks, including one weekend.
- Set EnPIs and a baseline. For each significant energy use, choose an indicator such as kWh per unit, and record production volume and operating conditions for the baseline period.
- Walk through outside production hours. On a night without a shift or on a holiday, note the machines still running, the lights not needed, and the sound of air leaks.
- Carry out the inexpensive fixes. Repair leaks, lower the pressure setpoint in steps, apply the procedure for switching off idle machines, and inspect the capacitor bank. Record every fix as a work order so its date and scope are documented.
- Build the list of budgeted projects from measured data. VSDs, motor replacements, or chiller improvements are assessed with measured consumption and the average price from your own bill, not with catalog figures.
- Review on day 90. Compare performance against the normalized baseline, then set a monthly review and put checks such as leak surveys into the routine maintenance schedule.
Proving that the savings are real
Once a fix is made, the biggest temptation is to compare this month’s bill with last month’s. That almost always misleads, because production volume, product mix, the number of working days, and the weather change too. The bill can rise while efficiency improves, and it can fall simply because orders are slow.
ISO 50006 advises comparing performance against a normalized energy baseline, that is one adjusted for relevant variables such as production volume, and revising that baseline when static factors change, for example a new machine or a change in the number of shifts[2]. The question to ask is how much energy would have been used under this month’s conditions had the fix not been made, and that figure is then compared with the energy actually used. A worked calculation is given in the article on factory energy monitoring.
The measurement boundary matters as well. A saving of a few kilowatts on one compressor is hard to prove from the plant’s main meter, because it is lost in the variation of every other load. Measuring at that compressor’s own feeder, before and after the fix under comparable conditions, gives far clearer evidence.
Energy management obligations in Indonesia
For large plants, cutting electricity use is also a matter of compliance. Government Regulation Number 33 of 2023 on Energy Conservation requires energy users whose consumption exceeds a set threshold to carry out energy management[6]. In general terms, that energy management covers appointing an energy manager, preparing an energy conservation program, conducting energy audits periodically, implementing the audit recommendations, and reporting to the government[6]. These elements were set out earlier in Minister of Energy and Mineral Resources Regulation Number 14 of 2012 on Energy Management[7].
The consumption thresholds, the reporting format, and the implementing provisions are set in regulation and can be updated, so they should be checked directly in the text of the regulation in force and in information from the Ministry of Energy and Mineral Resources. Plants that are not yet obliged can still use the same framework. Its elements line up with ISO 50001: clear responsibility, an energy review, indicators and a baseline, action plans, and periodic evaluation[1].
Common mistakes
- Buying equipment before measuring. A VSD on a pump with a constant load, or an extra capacitor bank without knowing why the power factor is low, can use up the budget without changing the bill much.
- Judging success from last month’s bill. Changes in production volume and working days can hide a real saving or create an apparent one.
- Mixing the three kinds of saving. Moving load to the off-peak period and correcting power factor lower cost, not kWh. Both are useful, but they need to be recorded separately from energy efficiency.
- One-off campaigns. Leaks come back, setpoints are raised again, and the habit of switching machines off fades when no owner, schedule, or work order holds it in place.
- Sacrificing quality or safety. Switching off ventilation, cutting heating below what the process needs, or trimming maintenance to save electricity usually ends in a larger cost.
One limitation also needs to be stated plainly: not every plant has a large amount of waste waiting to be found. The size of the opportunity is only known after measuring, and the results of any fix depend on the starting condition, the production pattern, and how consistently it is carried out. No list of actions guarantees a particular amount of saving.
Conclusion
A lasting way to cut electricity use in a factory starts with the bill, but does not stop there. The bill shows which component is expensive: kWh, time of use, or power factor. Measurement by panel and by machine shows where the energy goes. An EnPI tied to output shows whether factory energy efficiency is really improving.
The most common sources of waste rarely need new technology to be found: machines running unloaded, compressed air leaks and pressure set too high, pumps controlled by valves, and HVAC settings nobody has reviewed. Fix the inexpensive things first, assess budgeted projects with measured data, prove the results against a normalized baseline, and make sure every fix has an owner so it does not slide back to where it started.
Frequently asked questions
How do you cut electricity use in a factory?
Start by reading the breakdown of the bill and measuring consumption per panel or large machine. Fix the inexpensive waste first, such as machines running unloaded, compressed air leaks, and setpoints that are too high, then prove the result against a baseline normalized for production.
Why is our factory electricity bill so high?
The cause may be production volume that has genuinely risen, consumption during peak (WBP) hours, a low power factor that brings kVArh charges, or waste such as load while nothing is produced and compressed air leaks. The bill breakdown and measurement per machine show which of these applies.
What is a reasonable factory electricity bill?
There is no single figure that applies generally, because the bill depends on the tariff class, connected capacity, kWh, the split between peak and off-peak periods, and power factor. The useful comparison is your own bill divided by output, such as rupiah and kWh per unit, month by month.
What are WBP, LWBP, and kVArh charges on an Indonesian industrial electricity bill?
WBP is the peak load period and LWBP the off-peak period; in certain tariff classes, consumption in each is priced differently. The kVArh charge applies to excess reactive energy when the average power factor falls below the set limit.
Where do factories usually waste the most electricity?
In many plants the largest waste is in motor and compressed air systems: machines running unloaded, air leaks and pressure set too high, and pumps and fans whose flow is controlled by valves. The order in your own plant can only be confirmed by measurement.
References
- [1]International Organization for Standardization. (2018). ISO 50001:2018 Energy management systems: Requirements with guidance for use. ISO.
- [2]International Organization for Standardization. (2014). ISO 50006:2014 Energy management systems: Measuring energy performance using energy baselines and energy performance indicators, General principles and guidance. ISO.
- [3]U.S. Department of Energy. (2014). Improving motor and drive system performance: A sourcebook for industry. U.S. Department of Energy, Advanced Manufacturing Office.
- [4]International Electrotechnical Commission. (2014). IEC 60034-30-1:2014 Rotating electrical machines, Part 30-1: Efficiency classes of line operated AC motors (IE code). IEC.
- [5]U.S. Department of Energy. (2016). Improving compressed air system performance: A sourcebook for industry (3rd ed.). U.S. Department of Energy, Advanced Manufacturing Office.
- [6]Pemerintah Republik Indonesia. (2023). Peraturan Pemerintah Nomor 33 Tahun 2023 tentang Konservasi Energi.
- [7]Menteri Energi dan Sumber Daya Mineral Republik Indonesia. (2012). Peraturan Menteri ESDM Nomor 14 Tahun 2012 tentang Manajemen Energi.