
Asset reliability
What is condition monitoring? Definition, techniques, and how to start in a plant
The chilled water pump has sounded slightly different since the start of the week, but nobody can say how different. Condition monitoring replaces that kind of impression with numbers measured regularly, compared against the machine’s own normal state, and read early enough to plan a response.
Key takeaways
- Condition monitoring is the practice of measuring and interpreting parameters that reflect machine health over time, so that change becomes visible before the machine loses its function.
- Techniques are chosen from how a machine usually fails: vibration, temperature and thermography, motor current, oil analysis, or ultrasound, each catching a different kind of damage.
- A machine is best judged against its own baseline; general limits such as the ISO 20816 zones are useful as an outer fence, not as the only yardstick.
- Stale data or a dead sensor must read as "unknown", not "healthy". A good program starts small, on a few critical machines, and then grows.
What condition monitoring means
Condition monitoring is the practice of regularly measuring parameters that reflect the health of a machine and interpreting how they change over time. Those parameters can be bearing housing vibration, motor winding temperature, the current a motor draws, particle content in gearbox oil, or pump discharge pressure. The aim is to know the condition of a machine without taking it apart, and to know it early enough to act calmly.
ISO 17359 gives general guidance for setting up a condition monitoring program, from choosing which machines to monitor to reviewing the results[1]. The standard reinforces an idea that is often forgotten: condition monitoring is not about fitting as many sensors as possible, but about choosing measurements that can detect the way a machine usually fails.
It helps to separate the activity from the strategy. Condition monitoring is the activity of measuring and interpreting. Condition-based maintenance (CBM) is the maintenance strategy that uses the results of that activity to decide when to act. Without decisions and actions, condition monitoring only produces charts.
How it differs from inspection rounds, preventive, and predictive maintenance
These four terms are often used interchangeably on the plant floor, yet their basis for decisions differs. Jardine and colleagues describe a CBM program as three steps: data acquisition, data processing, and maintenance decision making. They also distinguish diagnostics, which answers what is happening now, from prognostics, which estimates how much longer the machine can run[2]. Predictive maintenance is condition monitoring with that prognostic element added.
| Approach | Basis for decisions | Example on a pump | Limitation |
|---|---|---|---|
| Inspection rounds (patrols) | Human senses: looking, listening, touching | Operators note noise and leaks on a checksheet every shift | Symptoms are caught only once a person can sense them |
| Preventive maintenance | Calendar time or running hours | Bearings are replaced every 8,000 running hours | Blind to actual condition; healthy parts are replaced too |
| Condition monitoring | Measured parameters and their trend | Bearing vibration and temperature tracked against a baseline | Needs the right parameters and disciplined follow-up |
| Predictive maintenance | Measured condition plus an estimate of remaining time | The vibration trend is used to estimate when the bearing needs replacing | Estimates carry uncertainty and need data history |
Inspection rounds remain valuable, and in many plants they are the oldest form of condition monitoring. Their weakness is timing. In Moubray’s P-F curve framework, symptoms that human senses can pick up, such as a rough noise or a bearing housing that feels hot, generally appear late on the road to failure[3]. Instrument measurements can catch change earlier, which leaves a longer P-F interval, the time between the first detectable symptom and the loss of function, to work with.
The main techniques and what each catches
No single technique sees everything. Each is sensitive to a particular group of damage mechanisms, and the right choice is set by the failure mode you want to detect. Mobley covers these techniques and their application to plant equipment[4].
| Technique | What is measured | Usually catches | Application notes |
|---|---|---|---|
| Vibration | Overall values (for example RMS velocity) and the vibration spectrum | Unbalance, misalignment, bearing and gear damage, mechanical looseness | The primary technique for rotating machines; the spectrum helps point to the source |
| Temperature and thermography | Spot temperature or heat distribution from an infrared image | Poor lubrication, overload, loose electrical connections, damaged insulation | Needs comparison with similar components or earlier measurements |
| Motor current analysis (MCSA) | Phase currents and the stator current spectrum | Broken rotor bars, air gap eccentricity, phase imbalance | Can be measured at the panel, away from hard-to-reach machines |
| Oil analysis | Wear particles, viscosity, water and contaminants | Internal wear in gearboxes and hydraulic systems, contaminated or degraded lubricant | Sample based; results depend on how and where the sample is taken |
| Ultrasound | High-frequency sound waves | Compressed air and steam leaks, under-lubricated bearings, electrical arcing | Sensitive to early symptoms, but easily disturbed by background noise |
Summarized from Mobley [4], Randall [5], ISO 18434-1 [6], and Thomson and Fenger [7]. Detection capability in the field depends on measurement points, operating conditions, and analyst skill.
Vibration is usually the starting point for pumps, motors, compressors, and gearboxes, because many mechanical faults change the vibration pattern from an early stage. Randall explains how vibration signals carry information about the condition of bearings, gears, and other rotating components[5]. Thermography complements it on the heat side: ISO 18434-1 sets out general procedures for infrared thermography in condition monitoring, including the importance of comparing results with similar components under similar operating conditions[6].
Motor current analysis, or motor current signature analysis (MCSA), reads the condition of an induction motor from its current spectrum. Thomson and Fenger show that faults such as broken rotor bars and air gap eccentricity leave characteristic frequency components in the stator current[7]. The practical advantage is that current can be measured at the electrical panel, away from a motor installed somewhere hot, high, or hazardous.
The program flow in ISO 17359
ISO 17359 structures a condition monitoring program as a flow that starts from the machine and the way it fails, not from the sensor[1]. In summary, the flow runs as follows.
- Identify critical assets. List the machines and rate the impact of a stoppage on production, safety, and quality.
- Work out the failure modes. For each critical asset, establish how it usually fails and which symptoms come first.
- Choose the measurement method. Match parameters to failure modes, then set the measurement points, frequency, and instruments.
- Set alarm criteria. Define alert and danger limits from the machine’s baseline and, where applicable, from the relevant standard.
- Acquire data. Collect data consistently: the same measurement points, comparable operating conditions, and recorded timestamps.
- Diagnose. When a parameter crosses its criteria, identify the most likely component and damage mechanism, using a second technique if needed.
- Decide the action. Decide what is done, by whom, and when, taking the production schedule into account.
- Review the program. Compare findings with the actual condition found during repair, then adjust parameters, limits, and frequency.
The last step is the one most often skipped, yet it is where the program learns. If a bearing replaced because of an alarm turns out to be fine, the limit may be too tight. If a failure slips through without an alarm, the parameter or the frequency needs another look.
From raw signal to advice
Sensors only produce numbers. ISO 13374-1 describes how those numbers are processed into information that supports a decision, through six processing blocks in sequence[8].
- 01Data acquisition
- 02Data manipulation
- 03State detection
- 04Health assessment
- 05Prognostic assessment
- 06Advisory generation
Data acquisition turns sensor output into digital data with a timestamp and the identity of the measurement point. Data manipulation processes the signal, for example by computing an RMS value or a spectrum. State detection compares the result with limits or a normal pattern and flags deviations. Health assessment interprets those deviations: which component is degrading and how severely. Prognostic assessment estimates where the change is heading. Advisory generation turns all of it into a recommended action that someone can carry out.
This breakdown is useful when judging a system. Many systems stop at state detection: a light turns red, and that is the end of it. The greater value lies in the blocks that follow, and each block should show the basis for its conclusion, so that an engineer can check whether the interpretation makes sense.
Judging a machine against its own baseline
Two pumps of the same type can vibrate at different levels because their foundations, installation, and operating conditions differ. One fixed limit for every machine will be too loose for one and too tight for the other. The more useful question is therefore how far this machine has moved from its own normal state, its baseline. One simple alarm rule in common use is a statistical limit derived from baseline data.
Alarm limit from the baseline
Alarm limit = μ + k × σ
μ = mean of the parameter over the baseline period, under comparable operating conditions.
σ = standard deviation of the parameter over the same period.
k = a multiplier set by the team. A smaller value makes the alarm more sensitive, but also more often wrong.
The following figures are illustrative. Over four weeks of normal operation, the RMS vibration velocity at a pump’s bearing housing averages 2.0 mm/s with a standard deviation of 0.2 mm/s. With k = 3, the alarm limit is 2.0 + 3 × 0.2 = 2.6 mm/s. A value of 2.6 mm/s may still count as acceptable under the general limits for its machine class, but for a pump that has held steady around 2.0 mm/s for a full month, the rise is a meaningful change worth checking. The rule only works when the baseline is taken under comparable conditions; a pump with two different operating points should have a baseline for each.
General limits are still needed as an outer fence. For vibration, ISO 20816-1 divides vibration levels into four evaluation zones. Zone A is the level typical of newly commissioned machines. Zone B is considered acceptable for long-term operation. Zone C is normally considered unsatisfactory for long-term continuous operation, so the machine should run only for a limited period until there is an opportunity for remedial action. Zone D is severe enough to cause damage[9]. The same standard also looks at changes in vibration magnitude relative to the machine’s reference value, not only at absolute values[9]. Zone boundary values depend on the type, size, and support of the machine, so they need to be read from the relevant part of the standard.
Data quality: a dead sensor is not a healthy machine
A flat green chart is reassuring. But the chart may be flat because the machine is stable, or because the sensor stopped sending data three days ago and the system keeps showing the last value. Jardine and colleagues note that condition monitoring data can contain errors, among them errors caused by faulty sensors, which makes data cleaning an important step before analysis[2].
Simple data quality checks go a long way: when the last reading arrived, what share of the period actually has readings, whether values are still within the sensor’s physical range, and whether they change at all. When the data are not sufficient, any conclusion about the machine’s condition must carry a flag that its basis is weak.
Continuous and periodic monitoring
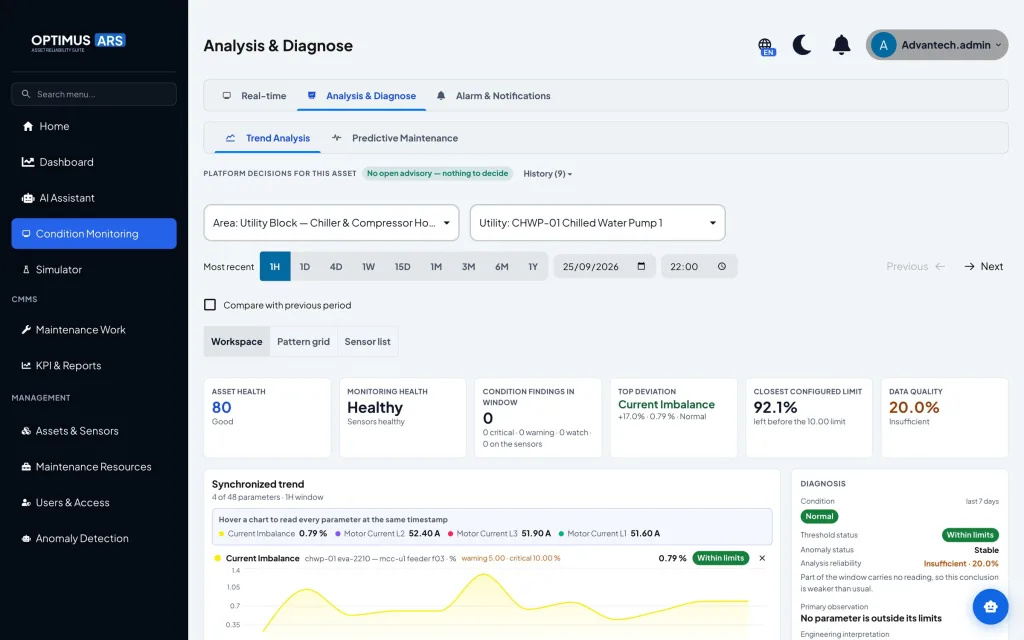
Periodic route-based monitoring is the classic approach: a technician carries a portable instrument, walks from machine to machine along a route, and takes data at the same measurement points every week or every month. The cost per machine is low, and it suits many assets whose damage develops slowly. Continuous, or online, monitoring uses permanently installed sensors that send data all the time. It costs more per point, but it catches change between two visits.
The choice between the two goes back to the P-F curve. Moubray stresses that the monitoring interval must be well below the P-F interval, so that time remains to act after a symptom is found[3]. If a fault can progress from detectable to failed within days, a monthly route will almost certainly miss it. Continuous monitoring also makes sense for machines that are difficult or dangerous to reach, and for machines whose operating conditions change often, so that a single spot reading is hard to interpret.
Wireless retrofit sensors or wired sensors
Battery-powered wireless sensors make retrofit on older machines easy: no cable runs across the plant, and installation can be finished within one shift. The trade-off is that, to save battery, such sensors generally send summary values, such as RMS velocity and temperature, at set intervals rather than the raw signal continuously. That is enough to detect a trend, but deeper diagnosis sometimes needs additional measurement. Wired sensors provide power and bandwidth that a battery does not limit, which suits critical machines that need detailed data or that are tied into a protection system. In practice many plants use both.
How to start on a few critical machines
A condition monitoring program does not have to start with the whole plant. A program that starts small is easier to prove, and its lessons shape how it grows next.
- Pick three to five machines. Put first the machines whose stoppage directly halts production or endangers safety, such as the main compressor, a chilled water pump, or a line drive motor.
- Read their history. Gather failure records and work orders for those machines from the CMMS or logbook. That history shows the failure modes that actually occur in your plant.
- Match techniques to failure modes. For bearing damage and misalignment, start with vibration and temperature; for motor electrical problems, add current; for gearboxes, consider oil analysis.
- Collect a baseline before switching on alarms. Allow a few weeks of normal operation, record the operating conditions, and then set limits from that data.
- Decide who follows up. Every alarm needs an owner: who checks, how quickly, and how the result is recorded as a work order.
- Monitor the sensors’ health too. Decide what happens when data stops arriving, and who checks the sensor.
- Review after three months. Count true and false alarms, note findings from repairs, and then decide which machines to add next.
Common mistakes and limits
- Starting from the sensor, not the failure mode. A parameter that is easy to measure is not necessarily the one that changes when a machine starts to fail.
- Using one limit for every machine. Generic limits cause false alarms on machines that naturally vibrate more, and miss changes on machines that are usually very quiet.
- Treating silence as health. Dead sensors, flat batteries, and disconnected gateways are often discovered only after the machine has failed.
- Leaving alarms without an owner. Alarms that are never followed up teach the team to ignore them, including the ones that are right.
- Expecting certainty. Condition monitoring improves the odds of catching damage early, but not every failure mode gives a measurable symptom, and some progress too fast for any monitoring interval.
That last limit deserves to be stated plainly. The RCM framework points out that an on-condition task is only worthwhile when there is a clear potential failure condition and a P-F interval long enough to use[3]. For failure modes that do not meet those conditions, other strategies such as scheduled replacement, functional testing, or a design change are the better fit.
Conclusion
Condition monitoring is the habit of measuring a machine’s condition regularly and interpreting it against that machine’s own normal state. It differs from inspection rounds because it uses instruments, differs from preventive maintenance because it rests on actual condition, and becomes the foundation of predictive maintenance once an estimate of what lies ahead is added.
The ISO 17359 and ISO 13374 frameworks give a clear order of work: start from critical machines and how they fail, choose suitable measurements, process the data all the way to advice, and then review the results. A program that starts with a few machines, with an honest baseline, well-kept data, and alarms that always have an owner, yields enough lessons to grow with confidence.
Frequently asked questions
What is condition monitoring?
Condition monitoring is the practice of regularly measuring parameters that reflect machine health, such as vibration, temperature, and motor current, and interpreting how they change over time.
What is the difference between condition monitoring and predictive maintenance?
Condition monitoring measures and assesses the current condition of a machine. Predictive maintenance uses those monitoring results and adds an estimate of how much longer the machine can run before it needs attention.
Which condition monitoring technique is most common?
For rotating machines, vibration analysis is the most common technique, usually complemented by temperature. Motor current analysis, oil analysis, thermography, and ultrasound are used according to the failure mode to be detected.
Why should alarm limits come from the machine’s baseline?
Machines of the same type can have different normal vibration levels because of their installation and operating conditions. A limit from the machine’s own baseline catches changes that matter for that machine, while general limits such as the ISO 20816 zones still serve as an outer fence.
Do I need sensors on every machine?
No. Start with a few critical machines whose stoppage has the greatest impact, build the baseline and the follow-up process, and then extend to other machines once the program has proven itself.
References
- [1]International Organization for Standardization. (2018). ISO 17359:2018 Condition monitoring and diagnostics of machines: General guidelines. ISO.
- [2]Jardine, A. K. S., Lin, D., & Banjevic, D. (2006). A review on machinery diagnostics and prognostics implementing condition-based maintenance. Mechanical Systems and Signal Processing, 20(7), 1483-1510.
- [3]Moubray, J. (1997). Reliability-centered maintenance (2nd ed.). Industrial Press.
- [4]Mobley, R. K. (2002). An introduction to predictive maintenance (2nd ed.). Butterworth-Heinemann.
- [5]Randall, R. B. (2011). Vibration-based condition monitoring: Industrial, aerospace and automotive applications. Wiley.
- [6]International Organization for Standardization. (2008). ISO 18434-1:2008 Condition monitoring and diagnostics of machines: Thermography, Part 1: General procedures. ISO.
- [7]Thomson, W. T., & Fenger, M. (2001). Current signature analysis to detect induction motor faults. IEEE Industry Applications Magazine, 7(4), 26-34.
- [8]International Organization for Standardization. (2003). ISO 13374-1:2003 Condition monitoring and diagnostics of machines: Data processing, communication and presentation, Part 1: General guidelines. ISO.
- [9]International Organization for Standardization. (2016). ISO 20816-1:2016 Mechanical vibration: Measurement and evaluation of machine vibration, Part 1: General guidelines. ISO.