
Productivity
What is OEE? How to calculate it, read it, and improve it
A machine can look busy all day and still produce far less than it should. OEE is a simple way to see that gap in a single number, and then to break it back down into causes that can be fixed.
Key takeaways
- OEE (Overall Equipment Effectiveness) is the product of three factors: availability, performance, and quality.
- A single OEE figure summarizes three kinds of loss: stoppages, reduced speed, and output that fails to meet requirements.
- An OEE value only means something if its definitions are consistent, above all for planned production time and ideal cycle time.
- The real value of OEE lies in breaking it down: which loss is largest, on which machine, and on which shift.
What OEE means
OEE stands for Overall Equipment Effectiveness. The indicator measures how much of the planned production time actually produces good parts, at the speed the machine is meant to run.
The concept was introduced by Seiichi Nakajima as part of Total Productive Maintenance (TPM), an approach to maintenance that developed in Japanese industry[1]. The underlying idea is that machine productivity cannot be judged simply by whether the machine is switched on. A machine that is running but running slowly, or running fast but turning out a lot of defects, is wasting capacity either way.
OEE therefore combines three questions in one number. Is the machine running when it is supposed to run? Is it running as fast as it can? And does what it produces meet quality requirements? An OEE of 100 percent means all three are fully met: no stoppages, ideal speed, and not a single defective part.
The OEE formula and its three components
The calculation starts from planned production time, which is shift time minus stoppages that are planned on purpose, such as breaks or a start-of-shift meeting. From there, three factors break down where that time is lost.
Availability
Availability = run time ÷ planned production time
Captures losses from the machine being stopped, whether through breakdowns or through changeovers and adjustments.
Performance
Performance = (ideal cycle time × total count) ÷ run time
Captures losses when the machine runs slower than its ideal speed, including minor stops that are not logged as downtime.
Quality
Quality = good count ÷ total count
Captures losses from defects, rework, and scrap produced while the machine is just starting up.
Overall Equipment Effectiveness
OEE = Availability × Performance × Quality
This is equivalent to (good count × ideal cycle time) ÷ planned production time. The second form is useful for cross-checking a result.
The international standard ISO 22400-2 also defines the OEE index as the product of three factors, with slightly different terms, for example effectiveness for the performance factor[2]. The difference in wording does not change the logic, but it is a reminder that every organization needs to write its definitions down explicitly.
A worked OEE example
Take one shift on an injection molding machine. The figures below are illustrative, not data from any particular plant, but the order of the calculation is the same one used on the shop floor.
| Data | Value |
|---|---|
| Shift length | 480 minutes |
| Planned breaks | 30 minutes |
| Planned production time | 450 minutes |
| Machine stopped (breakdowns and adjustments) | 45 minutes |
| Run time | 405 minutes |
| Ideal cycle time | 1.0 minute per unit |
| Total count | 360 units |
| Good count | 342 units |
- Availability = 405 ÷ 450 = 90.0%. One tenth of the planned time is lost to stoppages.
- Performance = (1.0 × 360) ÷ 405 = 88.9%. In 405 minutes of run time, the machine should have been able to make 405 units, but it produced only 360.
- Quality = 342 ÷ 360 = 95.0%. Eighteen units failed to meet requirements.
- OEE = 90.0% × 88.9% × 95.0% = 76.0%. Cross-check: (342 × 1.0) ÷ 450 = 76.0%.
The figure shows why the breakdown is more useful than the final number. An OEE of 76 percent does not tell anyone what to do. The fact that the speed loss is as large as the loss from stoppages, on the other hand, is a clear lead: besides reducing downtime, the team needs to find out why the machine runs below its ideal speed.
Six big losses: from the number to the cause
Nakajima grouped equipment losses into six categories known as the six big losses[1]. Each category falls under one of the three OEE factors, so a drop in any one factor can be traced to a specific type of problem.
| Loss | OEE factor | Examples on the shop floor |
|---|---|---|
| Equipment breakdowns | Availability | Burnt-out motor, seized bearing, hydraulic leak |
| Setup and changeover | Availability | Mold change, calibration, trial runs after setup |
| Minor stops and idling | Performance | Blocked sensor, jammed material, waiting for an operator |
| Reduced speed | Performance | Machine deliberately slowed because of vibration or unstable quality |
| Process defects and rework | Quality | Dimensions out of tolerance, surface defects |
| Startup losses | Quality | Parts scrapped until the process stabilizes after startup |
Grouping follows Nakajima (1988) [1].
The third category, minor stops, is often the most hidden loss of all. A stop of a minute or two is rarely logged as downtime, but when it happens dozens of times in a shift, its effect on the performance factor can be greater than that of a single major breakdown. Losses of this kind are almost impossible to see without automatic data capture from the machine.
What is a good OEE score?
A figure of 85 percent is often cited as world-class OEE. It is usually attributed to Nakajima, who suggested targets of more than 90 percent for availability, more than 95 percent for performance, and more than 99 percent for quality[1]. Multiplied together, those come to roughly 85 percent.
That figure is better read as a direction than as a fixed benchmark, however. A literature review by Muchiri and Pintelon shows that the definition and calculation of OEE vary widely between organizations and industries[3]. A machine with frequent changeovers, for example, will reasonably have lower availability than a continuous line making a single product. Comparing the OEE of two machines with different characteristics often leads to the wrong conclusion.
Common mistakes in measuring OEE
- Ideal cycle time is taken from habit, not from machine capability. If a speed that has already been lowered is used as the reference, the performance factor looks high while the loss is simply hidden. Hansen stresses the need for an honest speed reference if OEE is to be used for improvement[4].
- Planned time is treated inconsistently. If changeovers are sometimes counted as planned and sometimes not, the OEE figure will move up and down with no real change on the production floor.
- OEE is averaged across machines in a simple way. A combined OEE should be calculated from total time and total output, not as an average of percentages, because machines with longer planned time should carry more weight.
- Data is recorded by hand at the end of the shift. Records made from memory tend to miss minor stops and round off durations, so the performance loss looks smaller than it really is.
- OEE is used to rate operators. When a number is used to assign blame, the data tends to get tidied up. OEE is most useful as a tool for finding problems, not for finding someone to blame.
OEE, TEEP, and capacity utilization
OEE only assesses the time that is actually planned for production. If a plant runs only one shift, the other two shifts are left out of the calculation. To see capacity utilization as a whole, plants use TEEP (Total Effective Equipment Performance), which is OEE multiplied by the share of calendar time planned for production.
Total Effective Equipment Performance (TEEP)
TEEP = OEE × (planned production time ÷ calendar time)
TEEP answers a different question: how much of all the available time actually produces good parts.
The two complement each other. OEE helps improve how a machine is run, while TEEP supports capacity decisions, such as whether adding a shift makes more sense than buying a new machine.
Steps to improve OEE over time
- Put the definitions in writing. What counts as planned time, how the ideal cycle time is set, and when a part is counted as a defect.
- Automate data capture from the machine. Running and stopped status and production counts are best read directly from the PLC or sensors, so that minor stops are recorded too.
- Require a reason code for every stop. Downtime without a reason produces nothing but a number. A short, clear list of reasons allows losses to be grouped into the six big losses.
- Pick the single largest loss. Focusing on the one problem with the greatest impact, such as long setups on one machine, works better than trying to fix everything at once.
- Review by shift and by machine. Differences between shifts often reveal procedure or skill issues that a daily average never shows.
- Connect it to maintenance. Availability losses from recurring breakdowns belong to maintenance. Integrating OEE data with repair history in a CMMS helps separate equipment problems from operating problems.
Conclusion
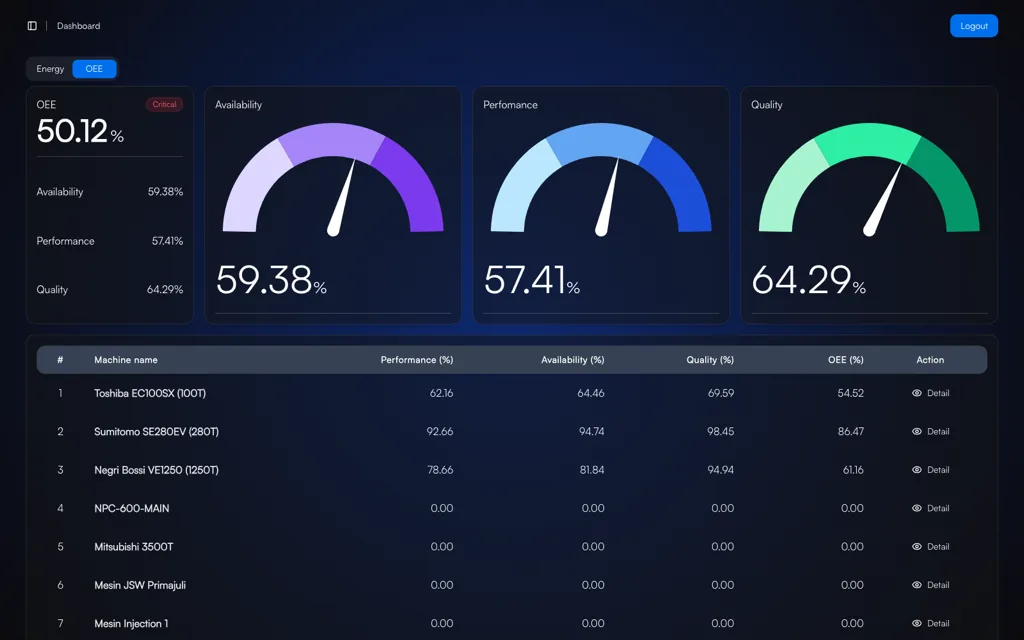
OEE is one of the simplest production indicators, and also one of the most often misused. Its simplicity makes a single number easy to report. Its real strength lies in the breakdown: how much time is lost to stoppages, how much to reduced speed, and how much to output that fails to meet requirements.
The plants that get the most out of OEE usually do three things with discipline: they write down their definitions, they capture data directly from the machine, and they review the largest losses regularly with the production and maintenance teams. A better number is the result of those habits, not the goal.
Frequently asked questions
What does OEE stand for?
OEE stands for Overall Equipment Effectiveness, an indicator that measures how effectively equipment is used against its potential, in terms of availability, performance, and quality.
What is the OEE formula?
OEE = Availability × Performance × Quality. The equivalent formula is good count multiplied by ideal cycle time, divided by planned production time.
What OEE score is considered good?
A figure of 85 percent is often cited as world-class and is usually attributed to Nakajima. In practice, a machine's OEE rising over time under consistent definitions matters more than how it compares with a benchmark.
What is the difference between OEE and TEEP?
OEE assesses only planned production time, while TEEP assesses all calendar time. TEEP is used for capacity decisions, OEE for improving how the machine is run.
Can OEE be calculated automatically?
Yes. Machine status and production counts can be read directly from the PLC or sensors, so availability and performance are calculated without manual tallies. The quality factor usually needs the defect count as input from an operator or an inspection system.
References
- [1]Nakajima, S. (1988). Introduction to TPM: Total productive maintenance. Productivity Press.
- [2]International Organization for Standardization. (2014). ISO 22400-2:2014, Automation systems and integration: Key performance indicators (KPIs) for manufacturing operations management, Part 2: Definitions and descriptions. ISO.
- [3]Muchiri, P., & Pintelon, L. (2008). Performance measurement using overall equipment effectiveness (OEE): Literature review and practical application discussion. International Journal of Production Research, 46(13), 3517-3535.
- [4]Hansen, R. C. (2001). Overall equipment effectiveness: A powerful production/maintenance tool for increased profits. Industrial Press.