
Maintenance management
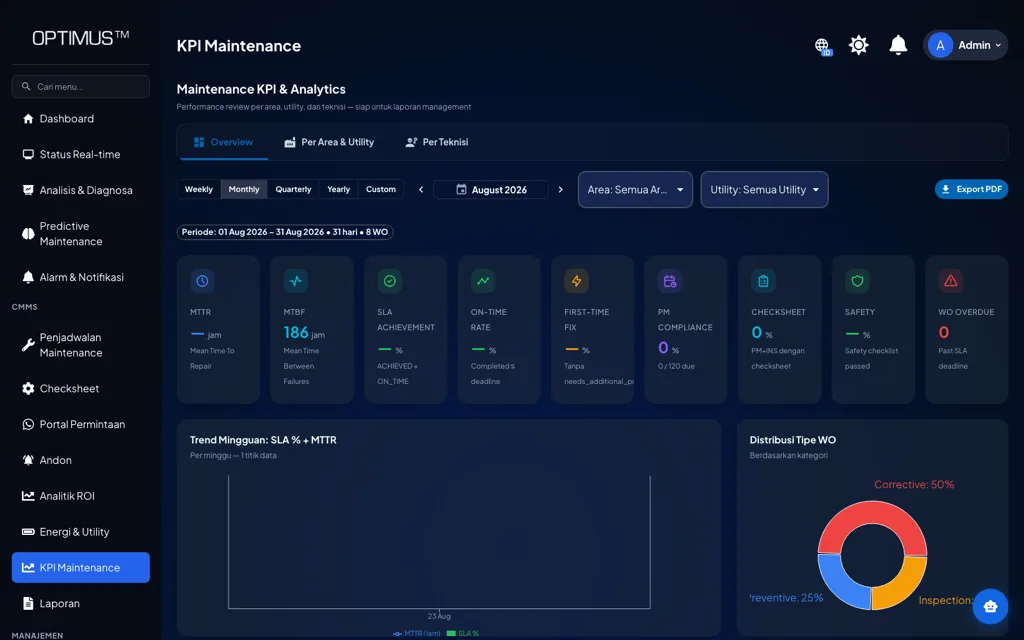
How to calculate MTBF and MTTR, and how to read them correctly
Almost every maintenance report includes MTBF and MTTR, yet few of them state how the two were calculated. Two plants can report the same figures from very different data, and one plant can make the wrong decision from correct figures. This article covers both, from definition to interpretation.
Key takeaways
- MTBF is the mean operating time between failures; MTTR is the mean time from a failure until the asset works again. For items that are replaced rather than repaired, MTTF is used instead.
- MTBF is not service life. Under a constant failure rate, the chance that an item survives to a time equal to its MTBF is only about 36.8%.
- MTTR becomes actionable only once it is broken down into detection, diagnosis, waiting for parts, repair, and testing.
- Both figures are only as good as their definitions and data: what counts as a failure, which clock is used, and how many events sit behind the number.
What MTBF, MTTR, and MTTF mean
MTBF (mean time between failures) is the average operating time of an asset between two failures. The IEC 60050-192 dependability vocabulary uses a more precise term, mean operating time between failures, to make clear that what is averaged is operating time, not calendar time[1]. MTBF applies to repairable items: a pump, a compressor, an injection molding machine, or a conveyor that is repaired after a failure and put back into service.
The R in MTTR is more troublesome. On the plant floor, MTTR is usually read as mean time to repair. IEC 60050-192 uses the same abbreviation for mean time to restoration[1]. Restoration time runs from the moment of failure until the item can perform its function again, so it includes the time before anyone notices the failure as well as administrative and logistic delays. Active repair time is only one part of it.
Both indicators rest on a term that is often taken as self-evident: failure. EN 13306 defines a failure as the loss of the ability of an item to perform a required function, and distinguishes it from a fault, the state of the item after a failure has occurred[2]. The definition sounds academic, but it is what decides which events are counted.
The metrics guidance of SMRP, the professional society for maintenance and reliability, is consistent with this idea of restoration: MTTR is the average time needed to restore an asset to its full operational capability after a loss of function[3]. In other words, the downtime clock keeps running until the asset is truly ready for production, not until the technician puts the wrench down.
For items that are replaced rather than repaired, such as bearings, mechanical seals, or fuses, the measure is MTTF (mean time to failure): the average operating time until the item fails[4]. The distinction matters in practice. The bearing in a pump has an MTTF, while the pump as a whole, whose bearing is replaced each time it fails, has an MTBF.
Formulas for MTBF, MTTR, and MTTF
All three indicators are calculated from the same records: when the asset ran, when it failed, and how long it took to recover. The basic formulas are simple averages, as used in the SMRP metrics guidance[3].
Mean time between failures
MTBF = total operating time ÷ number of failures
Operating time is the time the asset actually ran during the observation period, excluding planned stops and the restoration time after each failure.
Mean time to restoration
MTTR = total restoration time ÷ number of failures
Restoration time for each event runs from the moment of failure until the asset is running again and handed back to production.
Mean time to failure
MTTF = sum of operating times to failure ÷ number of failed units
Used for items that are replaced after failure. This simple form is only correct when every unit observed has already failed.
The caveat on the MTTF formula is easy to miss. When some units are still running at the end of the observation period, for example bearings that have never been replaced, the data are called censored and require an estimation method that accounts for them[4]. Calculating MTTF only from units that have failed makes the figure look shorter than it really is, because the longest-lived units have not yet entered the count.
A worked example for one pump
Take a cooling water circulation pump designed to run continuously. The figures below are illustrative, not data from a particular plant, but the order of the calculation is the same as the one used in practice.
| Data | Value |
|---|---|
| Observation period | 180 days |
| Calendar time | 4,320 hours |
| Planned stops (preventive maintenance and pump not required) | 120 hours |
| Number of failures | 4 |
| Restoration time per failure | 5.0, 8.5, 3.0, and 7.5 hours |
| Total restoration time | 24.0 hours |
- Operating time = 4,320 − 120 − 24.0 = 4,176 hours. Planned stops and restoration time do not count as operating time.
- MTBF = 4,176 ÷ 4 = 1,044 hours.
- MTTR = 24.0 ÷ 4 = 6.0 hours.
- Availability = 1,044 ÷ (1,044 + 6.0) = 1,044 ÷ 1,050 = 99.4%. Cross-check: 4,176 ÷ (4,176 + 24.0) = 4,176 ÷ 4,200 = 99.4%.
The average hides a wide spread. The fastest restoration took 3.0 hours and the longest 8.5 hours, almost three times as long. With four events, a spread like that is normal, and that is exactly where the lesson lies. The useful question is not "what is our MTTR" but "what made the second event take so much longer".
From MTBF and MTTR to availability
MTBF and MTTR are most useful when combined. An asset that rarely fails but takes days to recover can be just as unavailable as one that fails often but recovers quickly. The relationship between the two is expressed in the availability formula.
Inherent availability
A = MTBF ÷ (MTBF + MTTR)
In the textbook definition, MTTR in this formula covers active corrective maintenance time only. When MTTR includes waiting for parts and other delays, the result is closer to operational availability.
Ebeling distinguishes several kinds of availability according to which downtime is included[4]. Inherent availability counts only active corrective maintenance time, so it reflects the design of the asset and the skill of its repair. Operational availability also includes logistic and administrative delays, which brings it closer to what production experiences day to day.
In the pump example, the MTTR of 6.0 hours is full restoration time, including waiting for parts. The result of 99.4% is therefore closer to operational availability. If only active repair time is used, for example 3.0 hours per event as broken down in the next section, the result is 1,044 ÷ (1,044 + 3.0) = 1,044 ÷ 1,047 = 99.7%. The difference between the two figures is time lost not to engineering work but to waiting.
A figure of 99.4% also sounds high, which is one reason an availability percentage alone is rarely enough for a maintenance meeting. The gap to 100% amounts to 24 hours of unplanned stoppage across four events. If that pump supplies cooling water to several injection molding machines, it is the consequence of each event, not the percentage, that decides how serious the figure is.
MTBF is not service life
The most common misreading is to treat MTBF as a lifetime. An MTBF of 1,044 hours does not mean the pump will run for 1,044 hours and then fail, nor that it is safe until hour 1,044. MTBF is an average: some failures come much earlier, others much later.
The misreading becomes more misleading because many reliability calculations assume a constant failure rate. Under that assumption, the time between failures follows an exponential distribution, and MTBF equals the reciprocal of the failure rate, 1 ÷ λ[4]. The consequence often surprises people: the chance that an item survives to a time equal to its MTBF is only about 36.8%.
Reliability under a constant failure rate
R(t) = e^(−λt), where λ = 1 ÷ MTBF
R(t) is the probability that the item survives without failure up to time t. At t = MTBF, R = e^(−1) ≈ 36.8%, so the chance of failing before reaching the MTBF is about 63.2%.
O'Connor and Kleyner caution that MTBF is often mistaken for expected service life, and that the constant failure rate assumption does not hold for items that wear out[5]. Bearings, carbon brushes, and mechanical seals generally wear, so their failure rate rises with use. For items like these, a single average is not enough. The shape of the distribution, usually analyzed with the Weibull distribution, is far more useful for deciding when a planned replacement makes sense[4].
Breaking MTTR down into its stages
An MTTR reported as a single number hides where the time goes. A restoration event usually has several stages: the failure is noticed and reported, a technician arrives and diagnoses it, parts are located or ordered, the repair is carried out, and the asset is tested and handed back to production. The figure below breaks down the 6.0-hour MTTR from the pump example. The split is also illustrative.
In this illustration, half of the restoration time, 180 minutes, goes to detection and waiting for parts, two stages that involve almost none of the technician’s skill. A team that only tries to speed up the repair itself is working on the smaller share. In a case like this, critical spares held in the storeroom, or an alarm that reaches the on-call technician on the night shift directly, are likely to cut MTTR more than a technician working faster.
For MTTR to be broken down, a work order needs to record more than a start and finish time. At a minimum: when the failure occurred or was detected, when the technician started work, when the job was put on hold for parts and when it resumed, when the repair was finished, and when the asset was handed back. In a CMMS, technicians can enter these timestamps from the job site, and some can be taken automatically from machine status.
Data quality pitfalls
MTBF and MTTR are only as good as the data underneath them. Wireman stresses that maintenance indicators depend on data recorded correctly in the work order system[6]. Without it, indicators produce figures that look convincing but describe nothing. The six pitfalls below are the ones met most often.
- No written definition of failure. Does a five-minute stop caused by a dirty sensor count? What about a pump that still turns but whose flow has dropped below what the process needs? Under the EN 13306 definition, the second is already a failure if the required function is no longer met[2]. The plant needs to write down where the line is and apply it consistently.
- An unclear clock. Calendar time, scheduled time, and operating time give very different MTBF figures. A standby pump that runs only a few hours a month will look remarkably reliable if calendar time is used. Operating hours from an hour meter or machine status are the most honest basis.
- MTTR starts at the work order, not at the failure. If the start time is when the work order was created, the time between the machine stopping and the report coming in drops out of the calculation. On a night shift, that gap can be a sizable part of the total.
- Samples that are too small. Four failures are not a solid statistical basis. In the pump example, if one of the four events turns out to be better recorded as an adjustment, MTBF rises from 1,044 to 4,176 ÷ 3 = 1,392 hours, a third higher, without anything changing on the pump. Reliability textbooks give methods for calculating confidence intervals for MTBF, and with few failures those intervals are wide[5].
- Mixing different assets. A combined MTBF for "all pumps" mixes new and old pumps, clean water pumps and slurry pumps. One repeat offender (a bad actor) can hide inside an average that looks reasonable. If figures must be combined, calculate from total operating time and total failures, not from the average of each asset’s MTBF, and keep showing the per-asset breakdown.
- Planned work mixed with restoration. A scheduled component replacement is not restoration after a failure. If preventive work orders are included, both MTTR and MTBF are distorted.
Using the figures to decide what to do
The value of MTBF and MTTR lies not in the figures but in the questions they raise. Both are most useful when read together and compared with the trend of the asset itself, not with benchmarks from other plants whose definitions are unknown. Wireman places indicators like these within a broader hierarchy of indicators, so that each figure can be traced to the causes and actions beneath it[6].
| Pattern | What it usually indicates | Direction for action |
|---|---|---|
| Low MTBF, low MTTR | Small, repeated failures, such as a clogged sensor or jammed material | Root cause analysis of repeat failures; do not settle for quick recovery |
| Low MTBF, high MTTR | A seriously troubled asset that stops often and for long | Top priority: root cause analysis, condition monitoring, critical spares |
| High MTBF, high MTTR | Rarely fails, but takes long to recover when it does | Readiness: critical spares, written repair procedures, technician training |
| High MTBF, low MTTR | The desired state | Maintain it; do not cut planned maintenance without supporting data |
Low and high are read relative to the trend of the asset itself, or to similar assets calculated with the same definitions.
The directions in the table are a starting point for discussion, not a recipe. A falling MTBF on a compressor, for example, may come from the quality of spare parts, a change in production load, or a change in maintenance procedure. The figure shows where to look; root cause analysis shows what to change.
Watch how the two move together, too. An MTTR that falls because the team has switched to quick temporary fixes may be followed by an MTBF that falls a few months later. One indicator improving does not necessarily mean the asset is improving.
Steps to calculate and track MTBF and MTTR
- Write down the definitions. What counts as a failure, when restoration time starts and ends, and which clock is the basis for operating time.
- Calculate per asset. Start with critical assets, such as the main pumps, compressors, or the injection molding machines on the busiest line. Category figures come only after per-asset figures exist.
- Take operating hours from a reliable source. Hour meters, PLCs, or machine status are more trustworthy than estimates from the production schedule.
- Complete the timestamps on work orders. Record detection, start of work, holds, completion, and handover, and separate corrective from preventive work orders.
- Choose a long enough period. For assets that rarely fail, a rolling twelve-month period is steadier than a monthly figure. Show the number of failures next to MTBF so readers know how strong the basis is.
- Break MTTR down by stage. Identify the largest stage and make it the first target for improvement.
- Review regularly and tie the figures to action. Every asset that stands out needs an owner, a cause analysis, and a recorded decision.
Conclusion
The formulas for MTBF and MTTR are simple division. The hard part is every decision around them: what counts as a failure, which clock is used, when restoration is considered complete, and how many events are enough to draw a conclusion. Plants that write those decisions down and apply them consistently get figures they can compare from month to month.
Reading the figures calls for the same care. MTBF is a long-run average, not a schedule for the next failure. MTTR becomes actionable only once it is broken down into its stages. Read together, the two show which assets need attention and which part of the process wastes the most time; the right action is still decided by the team’s analysis on the floor.
Frequently asked questions
What are MTBF and MTTR?
MTBF (mean time between failures) is the average operating time of an asset between two failures. MTTR is the average time from the moment an asset fails until it works again.
What are the formulas for MTBF and MTTR?
MTBF = total operating time ÷ number of failures. MTTR = total restoration time ÷ number of failures. Operating time excludes planned stops and restoration time.
What is the difference between MTBF and MTTF?
MTBF is used for items that are repaired and put back into service, such as pumps or compressors. MTTF is used for items that are replaced after failure, such as bearings, seals, or fuses.
Is MTBF the same as the service life of a machine?
No. MTBF is a long-run average. Under a constant failure rate, the chance that an item survives to a time equal to its MTBF is only about 36.8%.
Does MTTR only count repair time?
It depends on the definition. In IEC 60050-192, MTTR is the mean time to restoration, which also includes the time before the failure is noticed and delays such as waiting for parts. Each plant should write down the definition it uses.
References
- [1]International Electrotechnical Commission. (2015). IEC 60050-192:2015, International electrotechnical vocabulary, Part 192: Dependability. IEC.
- [2]European Committee for Standardization. (2017). EN 13306:2017, Maintenance: Maintenance terminology. CEN.
- [3]Society for Maintenance & Reliability Professionals. SMRP Best Practices: Maintenance & reliability metrics. SMRP.
- [4]Ebeling, C. E. (2010). An introduction to reliability and maintainability engineering (2nd ed.). Waveland Press.
- [5]O'Connor, P., & Kleyner, A. (2012). Practical reliability engineering (5th ed.). Wiley.
- [6]Wireman, T. (2005). Developing performance indicators for managing maintenance (2nd ed.). Industrial Press.