
Maintenance management
Maintenance KPIs: the indicators, the formulas, and how to use them
Almost every maintenance department has KPIs, and almost every monthly meeting has got lost in them at some point: dozens of numbers on one slide, definitions that differ from area to area, and nobody sure what decision to take. This article covers maintenance KPIs from what they are, through the formulas of the core indicators, to choosing the few numbers that actually get used.

Key takeaways
- A maintenance KPI is a measurable indicator that shows whether maintenance is meeting its goals. Some are lagging (results), some are leading (the processes that come before results).
- Most KPI formulas are simple. What decides the quality of the numbers is a written definition and work order data coded consistently.
- There are no universal target values. Compare KPIs with the trend of your own assets and team, not with figures from another plant whose definitions you do not know.
- Choose 5 to 7 KPIs for each level, from technician to plant manager, and make sure every number is tied to a clear decision.
What a maintenance KPI is
A maintenance KPI is a key performance indicator used to judge whether the maintenance function is meeting its goals. The European standard EN 15341 describes a system for managing KPIs to measure maintenance performance, taking account of economic, technical, and organizational factors, with the aim of appraising and improving its efficiency and effectiveness[1].
To understand what is being measured, the definition of maintenance itself helps. EN 13306 defines maintenance as the combination of all technical, administrative, and managerial actions during the life cycle of an item intended to retain it in, or restore it to, a state in which it can perform the required function[2]. The consequence is that maintenance KPIs cannot stop at the condition of the machines. The quality of planning, the completeness of data, cost, and the way the team works all belong in them.
Not every number that can be calculated deserves to be called a KPI. The number of work orders this month is a metric; it becomes a performance indicator only when it is tied to a goal and a decision. ISO 55000 stresses this alignment: organizational objectives are translated into technical decisions, plans, and activities[3]. A good KPI bridges the two.
Leading and lagging indicators
Lagging indicators measure results after everything has happened: availability, MTBF, maintenance cost. Production and finance feel these numbers directly, but they arrive late. When the MTBF of a compressor drops in May, the cause may have started months before.
Leading indicators measure the processes believed to come before results: whether PM is done on time, whether the weekly schedule is met, whether the backlog is under control, whether spare parts are available. If PM compliance on that same compressor starts to slip in March, the team has time to act before the failures show up in the MTBF figure.
The two need to be paired. A lagging indicator without a leading partner only tells you there is a problem, with no hint of where to work. A leading indicator without a lagging partner easily turns into a measure of busyness: every PM is done, yet breakdowns do not fall. The link between them is itself a hypothesis to be tested against data.
Three groups of indicators in EN 15341
EN 15341 looks at maintenance performance from three angles: economic, technical, and organizational[1]. Broadly, economic indicators concern money, such as maintenance cost relative to asset value, the value of spare parts inventory, and the split of cost between preventive and corrective work. Technical indicators concern how assets behave: availability, failure frequency, MTBF, and MTTR. Organizational indicators concern how the work is managed: the share of planned work, backlog, adherence to schedule, and use of labor.
The standard contains a list of indicators far longer than any one plant needs, complete with definitions. Its practical value is twofold: definitions you can point to, and a balance check. A KPI set made only of technical indicators can reach high availability through expensive overtime and a storeroom piled with spares. A set made only of economic indicators can cut cost while assets age out of sight.
The core maintenance KPIs and their formulas
The table below lists eleven indicators most often used in plants. The formulas are general forms. Each organization still needs to write down its detailed definitions: what counts as a failure, which hours are used, and which work counts as planned.
| KPI | General formula | Type | What it shows |
|---|---|---|---|
| Availability | Time the asset is able to operate ÷ time the asset is required | Lagging | How often the asset is ready when production needs it |
| MTBF | Total operating time ÷ number of failures | Lagging | How rarely the asset fails; the basis for judging reliability |
| MTTR | Total restoration time ÷ number of failures | Lagging | How quickly the asset returns to service after a failure |
| Planned maintenance percentage (PMP) | Planned work hours ÷ total maintenance hours | Leading | The share of work done to a plan rather than as a reaction |
| PM compliance | PMs completed within their window ÷ PMs due | Leading | Whether the preventive program is actually carried out |
| Schedule compliance | Scheduled work hours completed as scheduled ÷ hours scheduled | Leading | Whether the weekly schedule can be trusted |
| Backlog | Total estimated hours of open work ÷ crew hours available per week | Leading | How many weeks of work have piled up ahead of the team |
| Maintenance cost as a share of RAV | Annual maintenance cost ÷ replacement asset value (RAV) | Lagging | How much is spent on maintenance relative to the value of the assets maintained |
| Emergency work ratio | Emergency or unplanned work hours ÷ total maintenance hours | Lagging | How much of the team’s day is driven by sudden breakdowns |
| First-time fix rate | Corrective work orders resolved without a repeat visit ÷ total corrective work orders | Lagging | The quality of diagnosis, skills, and spare parts readiness |
| Spare part stockouts | Spare part requests that cannot be met from the storeroom ÷ total requests | Leading | Whether the storeroom supports the work or instead lengthens MTTR |
Ratios are expressed as percentages, except MTBF and MTTR (hours) and backlog (weeks). Whether an indicator is leading or lagging depends on the question asked: a stockout, for example, is a result of the storeroom process but an early indicator for MTTR.
The first three rows are covered at length in how to calculate MTBF and MTTR. In short, MTBF is calculated from operating hours, not calendar hours, and MTTR only becomes actionable once it is broken down into detection, diagnosis, waiting for parts, repair, and testing. Availability here is availability from the maintenance point of view, the ability of an asset to be in a state to perform as required[2]. It differs from the availability factor in OEE, which compares run time with planned production time and also counts setups and changeovers.
PMP and PM compliance are often confused, yet they ask different questions. PMP asks what share of all maintenance hours was worked to a plan. PM compliance asks whether the preventive tasks that fell due were actually done. A plant can record high PM compliance and low PMP at the same time: few PM tasks, all of them done, while most of the team’s hours go to sudden breakdowns. Schedule compliance completes the pair. Palmer treats the weekly schedule as a crew commitment based on available hours, and schedule compliance as the measure of how much of that commitment was met[4]. A schedule broken by a genuine emergency is not a team failure but a signal to read alongside the emergency work ratio.
Maintenance cost as a share of replacement asset value (RAV) compares maintenance spending with the cost of rebuilding the same assets today. The indicator is useful for reading trends within one company. RAV is an estimate, so the way it is estimated has to be written down. Do not substitute book value: book value falls through depreciation, while the upkeep needs of aging machines tend to rise.
Calculating backlog in weeks of work
Backlog reported as a number of work orders is misleading. Forty small jobs such as replacing indicator lamps can be finished in two days, while five overhaul work orders can tie up the team for a month. Palmer recommends expressing backlog in crew weeks: total estimated work hours divided by the hours the crew can give each week[4].
Backlog in crew weeks
Backlog (weeks) = total estimated hours of open work ÷ crew hours available per week
Total estimated hours: the sum of estimated labor hours on all work orders that have been approved but not yet completed.
Crew hours available: technicians’ weekly working hours after deducting leave, training, meetings, and any other time that will certainly not be spent on backlog work.
The figures that follow are illustrative, not data from any particular plant. A mechanical crew has 6 technicians working 40 hours a week, giving a gross capacity of 6 × 40 = 240 hours. On average, 40 hours a week go to leave, training, and meetings, so crew hours available are 240 − 40 = 200 hours. There are 58 approved open work orders with a total estimate of 480 hours. The crew’s backlog is 480 ÷ 200 = 2.4 weeks.
That figure still needs breaking down. Of the 480 hours, 180 are on hold waiting for parts or for a machine shutdown window, and 300 are ready to work. The ready backlog, the backlog that can be worked now, is 300 ÷ 200 = 1.5 weeks, while the work on hold amounts to 180 ÷ 200 = 0.9 weeks. Two crews with the same total backlog can be in very different situations: one is short of people, the other short of parts or of chances to stop the machine.
The backlog trend means more than any single figure. A backlog that keeps rising means work is arriving faster than the team can finish it. A backlog close to zero is also suspicious: work requests may simply no longer be written because operators feel it is pointless.
Example maintenance KPIs by level: from technician to plant manager
Wireman arranges maintenance indicators in tiers, from corporate level indicators down to functional indicators at the level of day-to-day work[5]. Each tier makes different decisions and therefore needs different numbers: a plant manager does not need to see every technician’s first-time fix rate.
In practice, five to seven KPIs per level is about as many as one meeting can discuss properly. Indicators at the upper levels should be traceable to those below, in line with the alignment principle in ISO 55000[3]: availability of critical assets on the plant manager’s desk should break down into MTBF, MTTR, and PM compliance on the supervisor’s desk.
| Level | Example KPIs | Reviewed | Decisions supported |
|---|---|---|---|
| Technician | PM compliance on own tasks, first-time fix rate, completeness of failure codes on closed work orders, actual hours against estimate, repeat failures on assets in own area | Daily and weekly | Which job comes first and what to report to the planner |
| Planner and scheduler | Backlog in weeks (total and ready), schedule compliance, planned maintenance percentage, accuracy of hour estimates, work orders fully planned before scheduling, spare part stockouts | Weekly | Next week’s schedule, parts to order, and work to defer |
| Supervisor | Team schedule compliance, PM compliance, emergency work ratio, MTTR by area, first-time fix rate, area backlog, overtime hours | Weekly | Allocation of people, training needs, and escalation of problem assets |
| Plant manager | Availability of critical assets, MTBF of critical assets, maintenance cost as a share of RAV, emergency work ratio, backlog trend, maintenance related safety incidents | Monthly | Budget, headcount, replacement investment, and priorities for reliability programs |
Maintenance KPIs for the planner deserve a word of their own, because planners are often measured on numbers outside their control, such as MTBF. What a planner controls is the quality of the plan: whether hour estimates are sensible, whether parts, tools, and work permits are ready before a job goes on the schedule, and whether the backlog is under control. The planner’s KPIs should measure those things. Estimate accuracy, for example, decides whether a backlog figure in weeks can be trusted at all.
At technician level, KPIs work best for the team, not for ranking individuals. Completeness of failure codes is on the list because every KPI at the levels above depends on it. At plant manager level the list is dominated by lagging indicators, but the backlog trend keeps the monthly meeting from discussing only the past.
The data source: work orders coded by failure
Nearly every KPI in Table 1 comes from one source, the work order. Wireman stresses that maintenance indicators are only as good as the data recorded in the work order system[5]. A correct formula applied to incomplete data still produces a wrong number; the error is simply invisible.
ISO 14224 provides a widely cited framework for reliability and maintenance data. It arranges equipment in a tiered taxonomy, from installation down to maintainable item, and records each failure with its failure mode, mechanism, cause, and the way it was detected. Its maintenance data covers the type of activity, downtime, active repair time, and labor hours[6]. Although it was written for the oil and gas industries, its principles are widely adapted in manufacturing plants. To calculate the core KPIs, every corrective work order needs at least:
- The asset at the right level of the taxonomy, for example pump P-201, not just "utilities area".
- Complete timestamps: when the failure occurred or was detected, when work started, when it was put on hold and resumed, when it was finished, and when the asset was handed back to production.
- A failure mode from a closed list, such as leakage, high vibration, or fails to start, not free text.
- Cause and action chosen from a list, with free notes as a supplement.
- Labor hours and spare parts used, including whether the part was in stock when requested.
A closed list feels like a chore at first, but it is the only way failures can be counted. A note like "motor broken, replaced" cannot be grouped with "motor dead, swapped unit". Two records coded overheating on the same motor can be counted and become a reason for root cause analysis.
Why maintenance KPIs in Excel tend to break down
Most plants start their maintenance KPIs in Excel, and that is reasonable. A spreadsheet template can calculate every formula in Table 1 correctly. The problem rarely lies in the formulas, but in the path the data takes to reach them.
The first problem is the manual recap. Data from work order books, paper forms, and group chat messages is gathered at the end of the month and retyped. Timestamps are filled in from memory, small jobs are missed, and the KPIs arrive after the decisions they should support have passed. The second problem is drifting definitions. Each area keeps its own copy of the file, with the MTTR formula changed slightly by different people, until the figures of two areas can no longer be compared.
The third problem does the most damage: the numbers are cut off from their source. When MTTR jumps this month, nobody can open the four work orders behind it to see what happened. A number that cannot be checked ends up being argued over rather than used. Excel is still adequate for a small team with few assets, provided the definitions are written into the file and the data is recorded at the source. Once the monthly recap takes days or the numbers are routinely disputed, it is time to move recording into a CMMS.
Designing a maintenance KPI dashboard
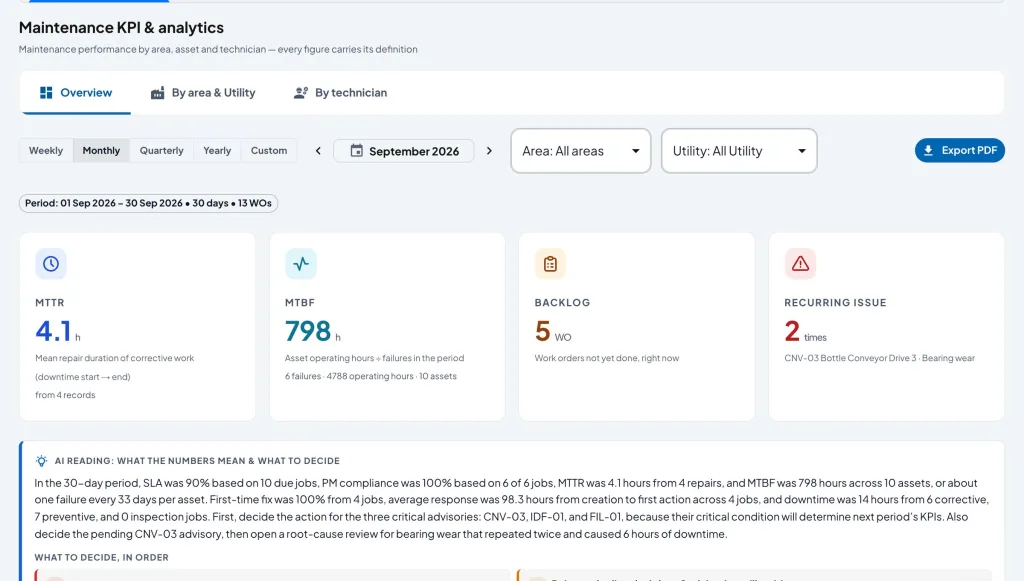
A maintenance KPI dashboard is not a place to display every indicator that can be calculated. A useful dashboard answers the questions of one level of reader on one screen, with numbers that can be checked.
- One screen for one level. Use the KPI set from Table 2, not all of them combined.
- Show the definition and the amount of data. An MTTR of 4 hours from 3 events and an MTTR of 4 hours from 40 events are not equally strong. Readers need to see both.
- Put trends first. A single figure for this month is rarely enough to decide anything. For assets that rarely fail, a rolling period is more stable than a monthly figure.
- Place leading and lagging pairs side by side, for example PM compliance next to MTBF for the same group of assets.
- Make every number clickable down to its work orders, so that a spike can be checked in minutes.
- Use color only for agreed limits. When every card is red or green, the color no longer means anything.
Steps to set up a maintenance KPI set
- Start from goals. Write down two or three maintenance goals for this year, such as safety, availability of critical lines, and cost control.
- Identify critical assets. Reliability indicators are calculated first for assets whose failure stops production or endangers people.
- Choose a leading and lagging pair for each goal, then arrange them into five to seven KPIs per level as in Table 2.
- Write a KPI dictionary. For each indicator: definition, formula, unit, data source, period, and owner. Refer to the EN 15341 definitions where available rather than inventing your own terms[1].
- Prepare the data at the source. Complete work orders with failure codes, timestamps, and hour estimates before calculating anything[6].
- Measure a baseline over several months before setting targets. The first target is a direction of improvement from your own figures, not a number borrowed from another plant.
- Review at a rhythm that suits each level, daily or weekly on the shop floor and monthly in management, and record the decisions taken at every review.
- Evaluate the KPI set every year. A KPI that has never triggered a single decision should be replaced.
Common mistakes in using maintenance KPIs
- Too many KPIs. Twenty indicators on one slide means none of them is really discussed. Every KPI added takes attention from the others.
- Rewarding the number instead of the outcome. When PM compliance becomes a bonus target, PMs tend to be closed without being done properly. When low MTTR is praised, work orders tend to be closed before the asset is really handed back.
- Measuring compliance with the wrong tasks. High PM compliance does not mean the program is right. Moubray stresses that a proactive task is worth doing only if it is technically able to deal with the failure mode and worth doing in light of the consequences of that failure[7].
- Mixing definitions. Adding up MTTR from one area measured to handover with another measured to the end of repair produces a meaningless figure.
- KPIs with no owner and no decision. A number reported every month that never changes anything only adds to the recap workload.
- Using KPIs to blame people. When numbers are used to find who is at fault, data tends to get tidied up and the real problems disappear from the report.
Conclusion
The usefulness of maintenance KPIs is rarely decided by their formulas, which are simple divisions. What decides it is everything around them: definitions that are written down and applied consistently, work orders coded by failure, and a number of indicators small enough to be discussed properly.
Plants that get value from KPIs usually choose a few numbers per level, pair leading indicators with lagging ones, compare them with their own trend, and tie every review to a recorded decision. Improving numbers are the result of those habits, not their purpose.
Frequently asked questions
What is a maintenance KPI?
A maintenance KPI is a key performance indicator used to judge whether the maintenance function is meeting its goals, from technical, economic, and organizational angles. Examples include availability, MTBF, MTTR, PM compliance, and backlog.
What are common examples of maintenance KPIs?
Common core KPIs are availability, MTBF, MTTR, planned maintenance percentage, PM compliance, schedule compliance, backlog, maintenance cost as a share of replacement asset value, emergency work ratio, first-time fix rate, and spare part stockouts. Each level should use 5 to 7 of them.
How do you calculate maintenance backlog?
Backlog in weeks is total estimated hours of open work divided by crew hours available per week. The result means more than a count of work orders, especially when work that is ready is separated from work on hold.
Which KPIs suit a maintenance planner?
KPIs for a planner should measure the quality of the plan: backlog in weeks, schedule compliance, planned maintenance percentage, accuracy of hour estimates, and parts readiness before work is scheduled.
Can maintenance KPIs be built in Excel?
Yes, especially for small teams, provided the definitions are written down and data is recorded at the source. Excel starts to struggle when the manual recap takes days, definitions differ between files, and numbers cannot be traced to the work orders behind them.
References
- [1]European Committee for Standardization. (2019). EN 15341:2019 Maintenance: Maintenance key performance indicators. CEN.
- [2]European Committee for Standardization. (2017). EN 13306:2017 Maintenance: Maintenance terminology. CEN.
- [3]International Organization for Standardization. (2014). ISO 55000:2014 Asset management: Overview, principles and terminology. ISO.
- [4]Palmer, D. (2019). Maintenance planning and scheduling handbook (4th ed.). McGraw-Hill Education.
- [5]Wireman, T. (2005). Developing performance indicators for managing maintenance (2nd ed.). Industrial Press.
- [6]International Organization for Standardization. (2016). ISO 14224:2016 Petroleum, petrochemical and natural gas industries: Collection and exchange of reliability and maintenance data for equipment. ISO.
- [7]Moubray, J. (1997). Reliability-centered maintenance (2nd ed.). Industrial Press.