
Asset reliability
Machine vibration analysis: basics, parameters, and how to read the results
Every rotating machine vibrates, even when it is in excellent condition. What changes when a component starts to fail is the size and the pattern of that vibration. Vibration analysis is the way to read that change before it can be heard, felt as heat, or stops production.

Key takeaways
- Vibration analysis is the most widely used condition monitoring technique for rotating machines, because many mechanical faults change the vibration pattern from an early stage.
- Vibration velocity in mm/s RMS is commonly used to judge overall severity; displacement is more sensitive at low frequencies, acceleration at high frequencies.
- The overall value shows that the condition has changed, while the FFT spectrum helps show which component is the likely source.
- ISO 20816 zones are a starting point for evaluation, but the trend against the machine's own baseline is usually more meaningful than a single absolute reading.
What machine vibration analysis means
Vibration analysis is the practice of measuring a machine's vibration, processing the signal, and interpreting the result to judge the machine's mechanical condition. The aim is not simply to find out whether the machine vibrates, since every rotating machine does, but whether that vibration is still normal for that machine and, if not, where it comes from.
In the predictive maintenance literature, vibration monitoring is treated as the primary technique for rotating machines[1]. The reason is fairly simple. Pumps, motors, compressors, blowers, and gearboxes have components that turn at a known speed, and almost every mechanical fault in those components produces a repeating force: a rotor that is out of balance, two shafts that are not in line, a loose hold-down bolt, or a small defect on a bearing raceway. That repeating force shows up as vibration with a characteristic pattern, and that pattern is what the analyst reads[2].
Another strength of vibration is timing. Many mechanical faults change the vibration well before the machine feels hot or sounds noisy, which gives the maintenance team time to plan a repair. The link between early detection and planning time is covered in more depth in the article on predictive maintenance.
Three measurement quantities: displacement, velocity, and acceleration
Vibration can be expressed with three related quantities. Displacement states how far a point moves from its rest position. Velocity states how fast that point moves. Acceleration states how fast its velocity changes. All three describe the same motion, but each gives a different weight to the frequency of the vibration.
Relationship between the three quantities for sinusoidal vibration
v = 2πf × d and a = 2πf × v
d = displacement, v = velocity, a = acceleration (all three expressed as the same kind of value, for example all peak values).
f = vibration frequency in Hz.
Because the formula contains a frequency factor, low-frequency vibration looks large in displacement but small in acceleration, and the reverse. The following numbers are illustrative. A sinusoidal vibration with a velocity amplitude of 2 mm/s (peak) at 10 Hz corresponds to a displacement of about 31.8 µm and an acceleration of about 0.126 m/s². The same velocity at 1,000 Hz corresponds to a displacement of only about 0.318 µm, but an acceleration of about 12.6 m/s². The velocity is identical, yet the impression given by the other two quantities is very different.
| Quantity | Common unit | Most sensitive to | Typical use |
|---|---|---|---|
| Displacement | µm, often peak to peak | Low frequencies | Low-speed machines; shaft motion relative to a journal bearing, measured with a proximity probe |
| Velocity | mm/s RMS | Mid frequencies | Overall severity assessment on the bearing housings of rotating machines |
| Acceleration | m/s² or g | High frequencies | Early rolling bearing damage, gear problems, envelope analysis |
For general evaluation on non-rotating parts of a machine, such as bearing housings, ISO 20816-1 commonly uses velocity RMS in mm/s measured over a broad frequency range[3]. RMS (root mean square) represents the energy content of the vibration, so it is more stable to compare over time than an instantaneous peak value. Displacement remains important for large machines with journal bearings, while acceleration is the choice when the target is a high-frequency symptom, such as an early defect in a rolling element bearing.
Overall value and FFT spectrum
The vibration signal from a sensor is a mixture of many vibrations at once: from the rotor, the impeller, the bearings, the fluid flow, even from the machine next door. There are two main ways to summarize that mixture.
The overall value is a single number that represents all the vibration within a given frequency range, for example 3.2 mm/s RMS. It is easy to record, easy to compare, and well suited to alarms. Its weakness is that it does not explain the cause. Two pumps with the same overall value can have entirely different problems.
The spectrum breaks the same signal into its frequency components. This is usually done with the Fast Fourier Transform (FFT), an algorithm that calculates how much vibration is present at each frequency[2]. A common analogy is a prism splitting white light into its colors. The result is a chart with frequency on the horizontal axis and amplitude on the vertical axis. Each peak on the chart points to a source of vibration that repeats at that frequency.
The key to reading a spectrum is knowing the machine's running speed, because many mechanical faults appear at multiples of the rotation frequency. That rotation frequency is called 1×, its second multiple 2×, and so on.
Running speed frequency (1×)
f(1×) = n ÷ 60
n = shaft speed in r/min (revolutions per minute).
f(1×) = rotation frequency in Hz. The second harmonic (2×) is twice this value, the third harmonic (3×) three times, and so on.
The following numbers are illustrative. A pump is driven by a two-pole motor running at 2,970 r/min. The 1× frequency is 2,970 ÷ 60 = 49.5 Hz, the 2× frequency is 99 Hz, and the 3× frequency is 148.5 Hz. If the spectrum shows a dominant peak exactly at 49.5 Hz, the analyst knows the vibration repeats once per shaft revolution. The example also shows why spectral resolution matters: in a motor supplied from a 50 Hz grid, magnetic forces typically produce vibration at 100 Hz, only 1 Hz away from this pump's 2×. Without fine enough resolution, the two can read as a single peak.
Common fault patterns in the spectrum
Once the running speed is known, the spectrum can be matched against well-known fault patterns. These patterns are not absolute rules. They are tendencies documented in the literature and in field experience, and one pattern can have more than one possible cause.
| Fault | Typical spectrum signature | Usually dominant direction |
|---|---|---|
| Unbalance | Dominant peak at 1× running speed | Radial (horizontal and vertical) |
| Shaft misalignment | Peaks at 1× and 2×, sometimes with 3× | Often high in the axial direction |
| Mechanical looseness | Many 1× harmonics in a row, sometimes with subharmonics | Depends on where the looseness is |
| Rolling bearing defect | Peaks at bearing defect frequencies that are not whole multiples of 1×; often clearer with envelope analysis | Radial, especially in the bearing load zone |
These signatures are typical and need confirmation from other data. Summarized from Randall [2] and Mobley [1].
Rolling bearings need particular attention. Every bearing has defect frequencies that can be calculated from its geometry and the shaft speed: frequencies for defects on the outer race, the inner race, the rolling elements, and the cage. This is why the type number of the installed bearing is very useful data for an analyst. At an early stage, the small impacts from a bearing defect carry little energy and are easily buried among other vibration. Envelope analysis addresses this by filtering the high-frequency band where those impacts excite a resonance, then taking the envelope of the signal so that the repetition frequency stands out[2].
These patterns overlap. A high 1× peak, for example, can come from unbalance, but also from a bent shaft or a structural resonance. A good analyst does not stop at one spectrum. They compare measurement directions, look at the trend, and where needed use phase data or a physical inspection before drawing a conclusion.
Evaluating results: severity zones and trends
ISO 20816 evaluation zones
The first question after taking a measurement is usually simple: is this number good or bad? ISO 20816-1 answers it with a framework of four evaluation zones, A to D, for vibration measured on non-rotating parts of the machine[3].
| Zone | General meaning |
|---|---|
| A | Vibration typical of newly commissioned machines |
| B | Acceptable for unrestricted long-term operation |
| C | Unsatisfactory for long-term continuous operation; the machine may run for a limited period until there is an opportunity for remedial action |
| D | Severe enough to risk causing damage to the machine |
Numeric limits between zones are not given here because they depend on the type, size, and support of the machine. See the relevant part of the standard for your machine class [3] [4].
The numeric limits between zones do not apply equally to every machine. Other parts of the ISO 20816 series give values for specific machine groups. ISO 20816-3, for example, applies to industrial machines with a power rating above 15 kW and speeds between 120 and 30,000 r/min, and it distinguishes machines by size and by the stiffness of their support[4]. A 30 kW pump on a rigid concrete foundation and a large fan on a flexible steel frame are not judged against the same limits. So before using a limit table from the internet or from an instrument manual, make sure the machine class and support type match.
Trend against the machine's own baseline
ISO zones are a useful starting point, but a single absolute reading rarely tells the whole story. Two compressors of the same model can have different normal vibration levels because their foundations, piping, or repair histories differ. What matters more is change: how far a machine's vibration has moved from its baseline, the value recorded when the machine was known to be in good condition. ISO 20816-1 itself treats a change in vibration magnitude, not only its size, as one of the evaluation criteria[3].
A trend can only be read when the measurements are consistent. The measurement point, direction, quantity, frequency range, and operating condition (speed and load) must be the same from one measurement to the next. Higher vibration on an injection molding machine running a heavier mold is not necessarily a sign of damage; it may simply be a different load.
Measurement points and practice
Vibration from the shaft and rotor travels outward through the bearings. That is why measurement points on non-rotating parts are usually placed on the bearing housings, as close to the bearing as possible and on a stiff load path. A fan cover, a thin sheet-metal panel, or a terminal box lid is not a good location, because those parts have vibration of their own.
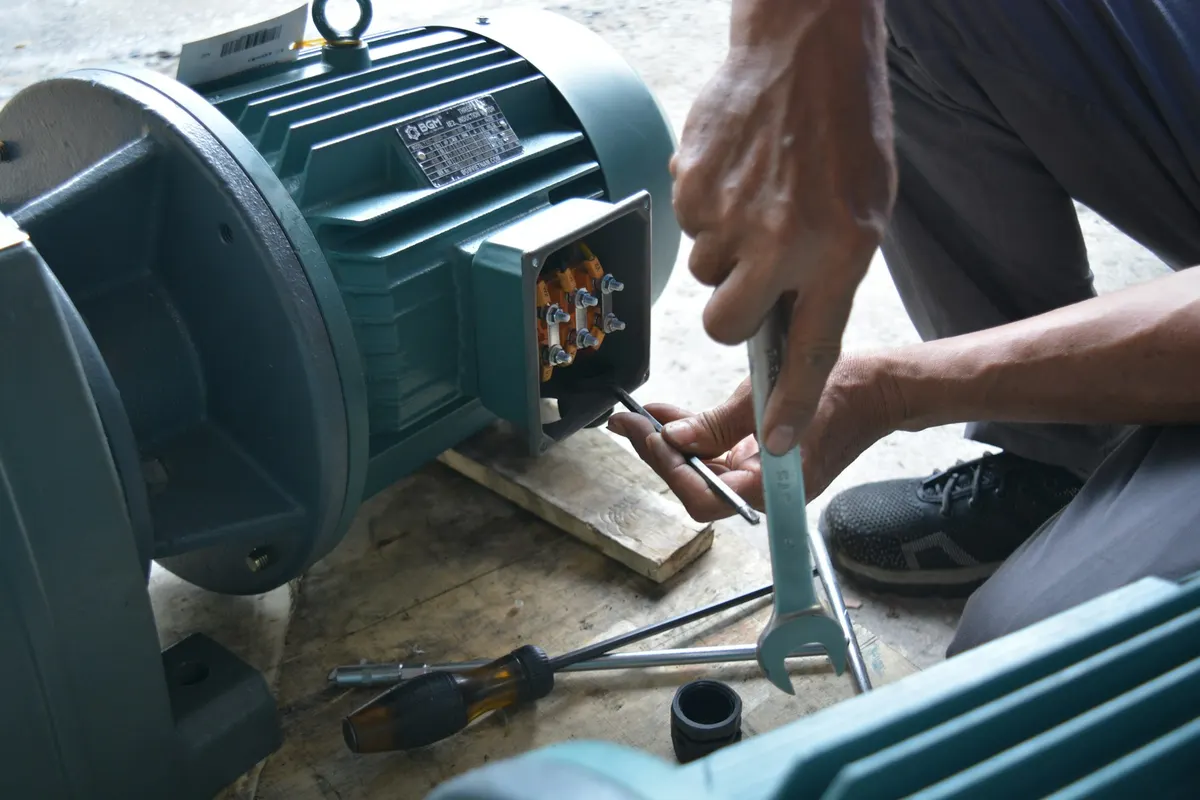
At each bearing housing, measurements are usually taken in three directions: horizontal and vertical (both radial, perpendicular to the shaft) and axial (along the shaft). Different directions capture different faults, as Table 2 shows. ISO 13373-1 gives general procedures for vibration condition monitoring, including the choice of measurement locations and directions, the selection of transducers, and how to mount them[5].
How a sensor is mounted affects the result. A sensor that is stud-mounted or bonded to a flat surface transmits high-frequency vibration far better than a magnetic sensor on a thick layer of paint, let alone a hand-held probe[5]. For route measurements, good practice is to mark every measurement point permanently, for example with a small bonded metal mounting pad, so that each measurement is taken at the same place and in the same way. Give each point a clear name, such as "Pump P-101, motor drive end, horizontal", so that data can be compared from month to month.
Portable route measurement and permanently installed sensors
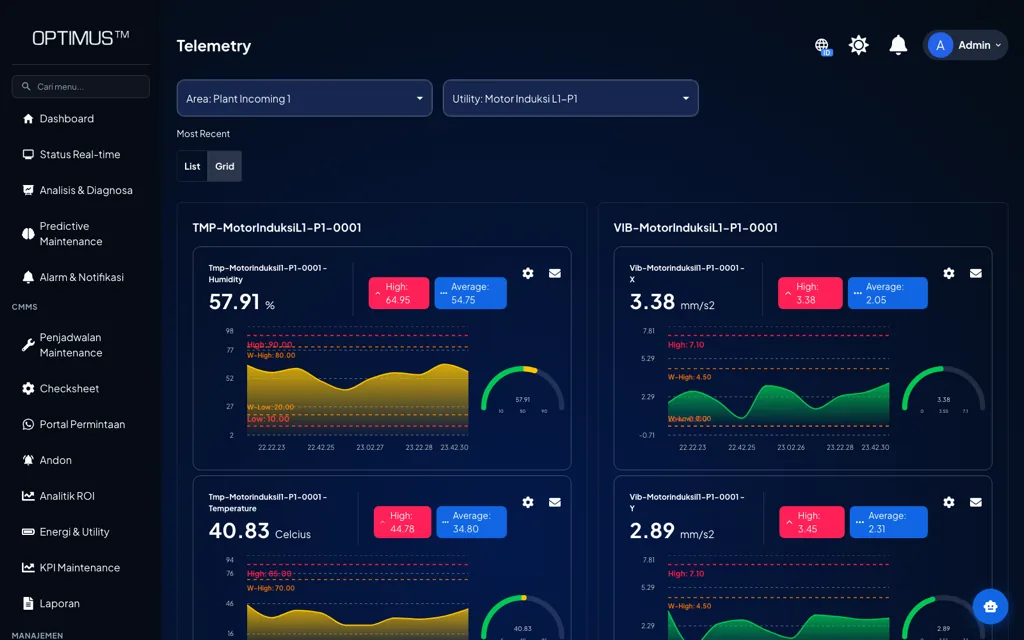
There are two main ways to collect vibration data. The first is route measurement with a portable instrument: a technician walks a fixed list of machines, measures at each point, and uploads the data for analysis. The second is permanently installed sensors, now often battery-powered wireless sensors, which send data periodically without anyone visiting. ISO 13373-1 distinguishes between permanent and periodic monitoring systems of this kind[5], and Mobley discusses route-based data collection with portable instruments[1].
Both have their place. A portable instrument operated by a trained analyst generally produces rich data, with high-resolution spectra and long waveforms, but it only captures the condition on the day of the visit. If the route is walked once a month, a fault that develops within two weeks can be missed. Installed sensors fill that gap with far more frequent readings, and they can be fitted in places that are hazardous or hard to reach. In exchange, many wireless sensors limit the sampling rate, the record length, or the transmission frequency to save battery, so they are not always suited to in-depth diagnosis.
In practice, many plants combine the two. Installed sensors watch the trend on critical assets continuously and raise a warning when something changes, and an analyst then comes with a portable instrument for more detailed measurement and diagnosis.
Vibration analyst competence
Collecting vibration data is relatively easy to learn. Interpreting it is much harder. ISO 18436-2 sets requirements for the qualification and assessment of personnel in vibration condition monitoring and diagnostics in four categories, from Category I to Category IV[6]. Broadly, the entry categories cover collecting data according to established procedures and recognizing alarm conditions, while the higher categories cover diagnosis, the use of advanced analysis techniques, and the design and direction of monitoring programs.
This division is useful for building a team. Technicians on the plant floor can run routes, check readings that look abnormal, and keep measurement points consistent. Unclear cases need to be passed to a more experienced analyst, whether in-house or external. What should be avoided is a major decision, such as stopping the main compressor in the middle of a night shift, taken from a single number without the judgment of someone who understands the spectrum.
Steps to start a vibration analysis program
- Choose the assets to monitor. Start with the rotating machines whose stoppage has the greatest impact on production, safety, or quality, for example process pumps, air compressors, and main blowers.
- Collect the machine's technical data. Record the running speed, power, support type, bearing type numbers, number of impeller or fan blades, and number of gear teeth. This data is needed to calculate the frequencies to look for in the spectrum.
- Define and mark measurement points. Set a point on each bearing housing with its directions, mark it permanently, then organize the points into a route or into sensor mounting locations.
- Take a baseline. Measure when the machine is in good condition and running normally, and repeat after every major overhaul, because the condition after a repair becomes the new reference.
- Set initial limits. Use the ISO 20816 zones for the matching machine class as a starting point, then adjust them to the machine's own baseline and trend once data has accumulated.
- Set the measurement interval. Make sure the interval is short enough compared with how fast the faults you want to catch develop. The most critical assets can be monitored continuously.
- Link findings to action. Every valid finding should become a clear work order in the CMMS, then be verified with a repeat measurement after the repair.
Common mistakes and limits of vibration analysis
- Using the wrong limit table. Limits for one machine class are applied to another machine with a different size or support. The result is alarms that fire too often, or never at all.
- Comparing data that is not comparable. The measurement point moves, directions are swapped, or the machine is measured at a different load, and the difference is read as a change in condition.
- Looking only at the overall value. Early bearing damage often does not yet show in overall velocity. Without the spectrum, acceleration, or envelope analysis, these early symptoms are easily missed.
- Drawing a conclusion from one spectrum. Similar patterns can come from different causes. A diagnosis needs confirmation from other measurement directions, the trend, or a physical inspection.
- Not verifying after a repair. Without a repeat measurement, there is no way to confirm that balancing or alignment actually reduced the vibration, and the new baseline is never recorded.
- Assuming vibration catches every fault. Not every failure mode changes the vibration, for example some electrical insulation damage or lubricant contamination, and a fault that develops very quickly can occur between two measurements. Vibration is strongest when combined with other techniques such as temperature, motor current, or oil analysis.
Conclusion
Vibration analysis reads the condition of rotating machines from their vibration. Its basics can be summarized in a few ideas: choose the quantity that suits the frequencies you are looking for, use the overall value to know that something has changed and the spectrum to find the source, and calculate the running speed frequency so that the peaks in the spectrum can be tied to machine components.
The ISO 20816 zones provide an initial framework for judging severity, but the trend against the machine's own baseline is usually more meaningful. The results depend on simple discipline: consistent measurement points, comparable operating conditions, analysts with the right competence, and every finding followed up and verified. A program that starts this way on a few critical pumps and compressors can be expanded once its value is visible on the plant floor.
Frequently asked questions
What is machine vibration analysis?
Vibration analysis is the practice of measuring a machine's vibration, processing the signal, and interpreting the result to judge its mechanical condition, for example to detect unbalance, misalignment, looseness, or bearing damage.
What units are used to measure machine vibration?
For general evaluation on bearing housings, vibration velocity in mm/s RMS is the common choice. Displacement (µm) is more sensitive at low frequencies, while acceleration (m/s² or g) is more sensitive at high frequencies such as early bearing defects.
What is the difference between an overall value and an FFT spectrum?
The overall value is a single number representing all vibration within a given frequency range and is suited to trending and alarms. The FFT spectrum breaks the vibration into its frequency components, which helps show the source of the vibration.
What is the allowable vibration limit for a machine?
There is no single limit for all machines. ISO 20816 divides evaluation into zones A to D, with numeric limits that depend on the type, size, and support of the machine; for industrial machines above 15 kW, see ISO 20816-3. The trend against the machine's own baseline also needs attention.
Where should a vibration sensor be mounted?
Usually on the bearing housing, as close to the bearing as possible and on a stiff part, with measurements in the horizontal, vertical, and axial directions. The same points must be used consistently so the trend can be compared.
References
- [1]Mobley, R. K. (2002). An introduction to predictive maintenance (2nd ed.). Butterworth-Heinemann.
- [2]Randall, R. B. (2011). Vibration-based condition monitoring: Industrial, aerospace and automotive applications. Wiley.
- [3]International Organization for Standardization. (2016). ISO 20816-1:2016, Mechanical vibration: Measurement and evaluation of machine vibration, Part 1: General guidelines. ISO.
- [4]International Organization for Standardization. (2022). ISO 20816-3:2022, Mechanical vibration: Measurement and evaluation of machine vibration, Part 3: Industrial machinery with a power rating above 15 kW and operating speeds between 120 r/min and 30 000 r/min. ISO.
- [5]International Organization for Standardization. (2002). ISO 13373-1:2002, Condition monitoring and diagnostics of machines: Vibration condition monitoring, Part 1: General procedures. ISO.
- [6]International Organization for Standardization. (2014). ISO 18436-2:2014, Condition monitoring and diagnostics of machines: Requirements for qualification and assessment of personnel, Part 2: Vibration condition monitoring and diagnostics. ISO.