
Asset reliability
Root cause analysis (RCA) in maintenance: 5 Whys, fishbone, and how to run one
The same bearing is replaced for the fourth time in five months, and every time the work order closes with the same note: bearing failed, replaced. The machine runs again, but the problem never leaves. Root cause analysis is how a team stops replacing the symptom and starts removing the cause.

Key takeaways
- Root cause analysis (RCA) looks for the cause that, once removed, stops the same failure from happening again. Replacing the failed part only restores function.
- Root causes are usually layered: a physical root in the component, a human root in someone’s decision, and a latent root in the system that allowed that decision.
- The 5 Whys is quick and cheap but produces only one causal chain. Fishbone, FTA, and FMEA help reveal causes that branch.
- An RCA is finished only when its corrective actions have owners and due dates, and their effect has been verified against the failure data that follows.
What root cause analysis is
Root cause analysis (RCA) is a structured investigation that aims to identify the true cause of a problem and the actions needed to eliminate it[1]. The key words sit at the end of that definition. RCA does not stop at "what broke"; it keeps asking until it finds something that can be changed so the same failure does not return.
In maintenance, the difference between fixing and removing a cause is very tangible. When a conveyor drive stops because a bearing has seized, the first action is of course to replace the bearing and get the line running. That is the right job to do. The trouble starts when the same job is repeated every five weeks and nobody asks why that bearing keeps failing long before its normal life.
Replacing a bearing again and again treats the symptom. As long as the cause remains, whether water getting into the housing, the wrong lubricant, or a misaligned shaft, the new bearing will meet the same fate. Every replacement adds spare parts cost, technician hours, and downtime, while the note on the work order makes the problem look solved.
Physical, human, and latent roots
One of the most useful frameworks for RCA in industrial settings comes from Latino and colleagues. They distinguish three layers of roots that usually sit behind an equipment failure[2].
- Physical root: the actual mechanism that damages the component, for example corrosion of the bearing raceways because water got in and broke down the lubricant film.
- Human root: a person’s decision or action that triggers the physical root, for example spraying high-pressure water directly at the bearing housing during cleaning.
- Latent root: a weakness in the organization’s systems that makes that decision seem reasonable, for example a sanitation procedure changed without review by maintenance, or training that never explains which points must be protected.
The three layers matter because different corrective actions target different layers. Replacing a seal addresses the physical root. Reprimanding an operator touches the human root, but rarely lasts, because the next person will face the same situation. Action on the latent root, such as requiring maintenance to review every procedure change, is the most likely to prevent similar problems on other machines. Latino and colleagues also warn that an analysis that stops at the human root tends to end in blaming people rather than fixing the system[2].
When an RCA is worth doing
A serious RCA takes several people several days. Not every failure justifies that effort. The reliability-centered maintenance (RCM) framework teaches that failures are judged by their consequences: whether they threaten safety or the environment, whether they disrupt operations, or whether they only cost the repair[3]. The same principle applies to deciding which failures deserve to be traced to their roots.
- Recurring failures. The same failure mode on the same asset appears more than once within a given period. A simple rule, for example two events with the same mode within 90 days, can serve as an automatic trigger.
- High downtime cost. A single event stops a main line long enough that the lost production far exceeds the cost of the analysis.
- Safety and environment. Any failure that injures someone, nearly injures someone, or causes a release to the environment deserves analysis, whatever the repair costs.
- Failures that cannot be explained. A component fails well before its normal life, or failures start after a change in process, material, or supplier.
On the other hand, a formal RCA is usually unnecessary for a one-off failure of a cheap component that is deliberately run to failure, such as an indicator lamp or a fuse on a non-critical circuit. Latino and colleagues note that the largest losses often come from small chronic failures that keep recurring, because failures like these gradually become accepted as a cost of doing business[2]. Adding up the cost of repeat failures helps make that scattered loss visible.
Cost of repeat failures in one period
Cost = number of events × (downtime hours per event × downtime cost per hour + repair cost per event)
The downtime cost per hour is best agreed with production and finance, for example from the product margin lost per hour the line is stopped.
The repair cost covers spare parts and technician hours.
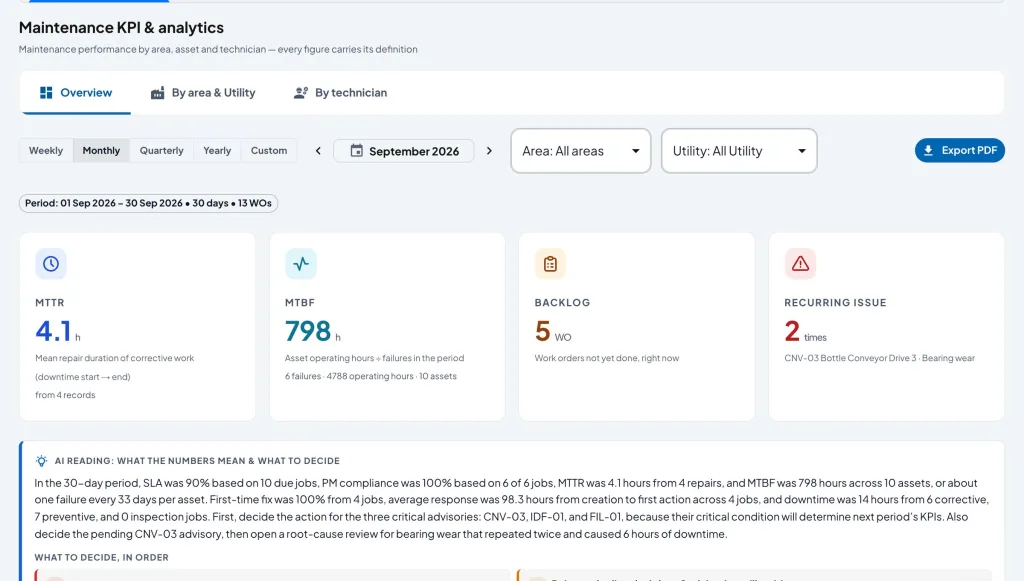
The figures below are illustrative, not data from any particular plant. A conveyor drive bearing fails 4 times in five months. Each event stops the line for 3 hours, the agreed downtime cost is IDR 4,000,000 per hour, and the repair cost is IDR 1,500,000 per event. The cost of the repeat failures is 4 × (3 × IDR 4,000,000 + IDR 1,500,000) = 4 × IDR 13,500,000 = IDR 54,000,000 over five months. A number like this is usually enough to convince management that a few days of team time for an RCA is a reasonable investment.
RCA tools and when each one fits
There are many RCA tools, but the four used most often in maintenance are the 5 Whys, the fishbone diagram, fault tree analysis (FTA), and failure mode and effects analysis (FMEA). The 5 Whys was popularized by Taiichi Ohno at Toyota: ask "why" repeatedly, about five times, until you reach a cause that can be fixed[4]. The fishbone diagram, or cause-and-effect diagram, was introduced by Kaoru Ishikawa to map every factor that may influence an effect[5]. FTA works down from an undesired top event, through AND and OR logic gates, to the basic events that cause it[6]. FMEA works in the opposite direction: for each component, how it can fail and what that does to the system[7].
| Tool | How it works | Best suited to | Limitations |
|---|---|---|---|
| 5 Whys | Asks "why" repeatedly, from the symptom to a cause that can be acted on | Simple problems with one clear causal path; quick analysis on the shop floor | Only one causal chain; the result depends heavily on the knowledge of whoever asks |
| Fishbone (Ishikawa) | Groups all possible causes into categories, commonly the 6Ms | Team brainstorming when the cause is still unclear; making sure no category is missed | Produces a list of possibilities, not evidence; each branch still has to be tested |
| Fault tree analysis (FTA) | Deductive, from a top event down to basic events with AND and OR logic gates | Complex failures with several causes that must occur together; safety-related events | Takes time and a good understanding of the system; trees grow quickly |
| FMEA | Inductive, from each component failure mode to its effects, then prioritized | Proactive analysis before a failure occurs; reviewing a design or a new asset | Not designed to investigate one specific event; easily becomes a formality |
Summarized from Ohno [4], Ishikawa [5], IEC 61025 [6], and IEC 60812 [7].
In practice, these tools complement each other. A common pattern is to open up the possibilities with a fishbone, deepen each branch that the evidence supports with the 5 Whys, and move to FTA when the failure involves several conditions that must happen together. FMEA fits better upstream, as a way to prevent failures that have not happened yet, and RCA findings often feed back into the FMEA for similar assets.
Example: a conveyor drive bearing that fails every few weeks
The following example is illustrative, not a case from any particular plant, but the pattern is plausible for any production area that is washed down routinely. On a bottling line, the bearing on the drive of a bottle infeed conveyor seizes 4 times in five months, roughly every five to six weeks. Each time, a technician replaces the bearing, applies fresh grease, and the line is running again in about 3 hours.
Tracing it with the 5 Whys
- Why did the conveyor stop? The drive-side bearing seized and the motor tripped on overload.
- Why did the bearing seize? Its raceways were rusted and its lubricant had broken down. The grease that came out was milky white, a sign that it had mixed with water.
- Why was there water inside the bearing? The housing seal could not hold back the high-pressure water sprayed at the drive area during sanitation at the end of every shift.
- Why was the drive area sprayed with high-pressure water? A few months earlier the line’s sanitation method was changed from wiping and brushing to high-pressure spraying, with no covers and no defined areas to avoid.
- Why did that change not take the bearing into account? The sanitation procedure change was decided by production and quality, and there was no mechanism requiring maintenance to review procedure changes that affect equipment.
This chain reaches all three layers of roots. The physical root is water entering the bearing and destroying its lubrication. The human root is the spray aimed directly at the housing. The latent root is a change in working method without cross-functional review, which in process safety management is known as the absence of management of change. Note that if the analysis had stopped at the second question, the conclusion would have been only "grease more often", and the bearing would still fail.
Widening the view with a fishbone
The 5 Whys above produces one convincing path, but not necessarily the only one. The team then draws a fishbone with "premature failure of the conveyor drive bearing" as the head of the fish, and fills each bone with possible causes following the commonly used 6M grouping.
- Machine: the housing seal is a standard type, not one designed for washdown areas.
- Method: the sanitation method changed; the relubrication interval was not adjusted for wet conditions.
- Material: the grease in use is not a water-resistant type.
- Manpower: new sanitation staff had never been told which points to protect from the spray.
- Measurement: there are no vibration or temperature checks, so damage is noticed only when the bearing has already seized.
- Mother nature (environment): the line area is humid and often wet throughout the shift, not only during sanitation.
The fishbone shows that the water spray is not the only factor. The unsuitable seal, the grease that is not water-resistant, and the lack of condition monitoring all contribute. Each of these possibilities is then tested against evidence: the condition of the bearing raceways, a grease sample, the seal specification, and the record of when the sanitation method changed. Possibilities the evidence does not support are struck out; those it supports go onto the action list.
The weaknesses of the 5 Whys
The 5 Whys is popular because it is simple, and that simplicity is also the source of its weakness. Card criticized the method in the context of patient safety, but his argument is relevant to the shop floor as well[8]. First, the 5 Whys forces a complex event into a single causal chain, when most failures have several contributing factors that interact. Second, the result depends heavily on who is asking. Different teams can analyze the same event and arrive at different root causes, because each person can only ask "why" as far as their own knowledge reaches.
This is not a reason to discard the 5 Whys, but a reason not to use it alone on failures that matter. Every answer therefore needs testing. Three habits help: demand evidence for every "because", use a fishbone or FTA so that other branches are not missed, and involve people from different functions, such as operators, technicians, and production staff, so the analysis is not limited to one person’s point of view.
The evidence to collect
An RCA without evidence is just a discussion of opinions. The most useful evidence is usually the easiest to lose, because once the machine is running again nobody feels the need to keep it. Four kinds of evidence are almost always needed.
- The failed part. The bearing, seal, coupling, or carbon brush that was removed, along with the lubricant or debris on it. The damage pattern on its surfaces often reveals the mechanism: rust, abrasive wear, material fatigue, or electrical pitting.
- Readings before the failure. Trends in vibration, temperature, motor current, or pressure in the days and weeks before the event, where available. This data shows when the damage started to develop and whether a change was missed. The article on vibration analysis explains how to read it.
- Work order history. How many times the asset has been repaired, by whom, with what action, and how far apart the events were. This history is what separates a chronic failure from a one-off event.
- Operating conditions. Load, speed, the product being run, the shift, the weather, and any recent changes to the process, materials, suppliers, or procedures.
Work order history is useful only if its contents can be grouped. A free-text note such as "bearing failed, replaced" cannot be counted. ISO 14224 provides a structure for reliability and maintenance data: each failure is recorded with its equipment and component, the failure mode (how the function was lost), the failure mechanism (the physical process that caused it), and the failure cause, each with a standard code list[9]. The standard was written for the oil and gas industries, but its structure can be borrowed by any plant.
With codes like these in a CMMS, the question "which assets had bearing wear more than once in the last three months" can be answered with one filter, instead of reading hundreds of notes one by one. Consistent coding is also what makes an automatic RCA trigger, such as the two-events-in-90-days rule, possible to run at all.
From findings to corrective actions
An RCA report that ends with a list of causes has not solved anything. Each proven root needs to be translated into a specific action, with one owner and one due date. Andersen and Fagerhaug stress that actions must target the causes found, not just repair the visible effect[1]. For the conveyor example, the action list might look like this.
- Physical root: replace the housing seal with a type designed for washdown areas and switch to a water-resistant grease. Owner: mechanical maintenance supervisor. Due: two weeks.
- Human root: revise the sanitation instruction with photos of the points that must not be sprayed directly, then retrain all sanitation staff. Owner: production supervisor. Due: three weeks.
- Latent root: require a maintenance review for every procedure change that affects equipment. Owner: plant manager. Due: one month.
- Similar assets: inspect other conveyors in wet areas that use the same seal and grease. Owner: maintenance planner. Due: one month.
The final step, and the one most often skipped, is verification. An action counts as successful not when it has been carried out, but when the data that follows shows the failure has not returned. In this example, the bearing used to fail roughly every five to six weeks, so one month without a failure proves nothing. A reasonable verification watches the asset for several of its previous failure intervals, together with checks on the grease condition and the asset’s MTBF trend. If the failure still occurs, the RCA is reopened, because it means a root has not yet been found.
Steps to run an RCA
- State the problem precisely. Which asset, which failure mode, when, how often, and with what impact. "The drive-side bearing on the line 2 bottle conveyor seized 4 times in five months" is far more useful than "the conveyor breaks down a lot".
- Secure the evidence. Keep the failed part, take a lubricant sample, photograph the conditions on site, and download sensor data and work order history before they are lost or overwritten.
- Form a small cross-functional team. Three to five people: the operator who runs the machine, the technician who repairs it, a production representative, and a facilitator who was not directly involved in the event.
- Build the sequence of events. Reconstruct what happened, when, and under what conditions, from data and accounts, including any changes in the last few months.
- Analyze with the right tool. Open up the possibilities with a fishbone, go deeper with the 5 Whys, and use FTA when the failure requires several conditions occurring together.
- Test every hypothesis against evidence. Strike out causes the data does not support. Flag those that cannot yet be proven and decide how to test them.
- Assign actions for every layer of root. Physical, human, and latent, each with an owner and a due date, then log them as work orders so they can be tracked.
- Verify and share the result. Watch the failure data after the actions, close the RCA only when the failure does not return, and apply the lessons to similar assets.
Common mistakes
- Looking for someone to blame. Once the analysis lands on a person’s name, the discussion usually stops. People who fear blame also stop giving honest accounts, and the latent root is never touched.
- Stopping too early. "Bearing wear" and "insufficient lubrication" are physical roots, not the end of the analysis. If the only resulting actions are "replace the part" or "lubricate more often", the analysis is most likely not finished.
- Analyzing without evidence. Conclusions drawn from one senior person’s experience, without looking at the failed part or the data before the event, are easily wrong and hard to test.
- Actions without owners and due dates. Recommendations such as "training needs to be improved" with no name and no date are almost certain not to happen.
- No verification. The RCA is closed when the report is finished, not when the data proves the failure has stopped. As a result, the same failure comes back and a new RCA starts from zero.
Conclusion
Root cause analysis changes the maintenance team’s question from "what broke" to "why does this keep breaking". The answer is rarely single. Behind a seized bearing there is usually a physical mechanism, someone’s decision, and a system that allowed that decision. Tools such as the 5 Whys and the fishbone help trace them, provided every answer is tested against evidence and no single tool is treated as the only path.
An RCA is not needed for every failure. Start with failures that recur, are expensive, or involve safety, make sure failure history is recorded with consistent codes, and do not close the analysis until the data shows the failure has really stopped. One thorough RCA on one chronic asset often yields lessons that apply to many others.
Frequently asked questions
What is root cause analysis (RCA) in maintenance?
Root cause analysis is a structured investigation to find the true cause of a failure and the actions needed to eliminate it, so the same failure does not happen again. Unlike an ordinary repair, RCA does not stop at replacing the failed part.
What is the difference between the 5 Whys and a fishbone diagram?
The 5 Whys traces a single causal chain by asking "why" repeatedly. A fishbone diagram maps many possible causes at once across several categories, commonly the 6Ms. The two are often used together: the fishbone to open up possibilities, the 5 Whys to deepen the branches the evidence supports.
What are the 6M categories in a fishbone diagram?
The commonly used 6M grouping is manpower, machine, method, material, measurement, and mother nature (the environment). These categories help the team make sure no source of causes is missed during brainstorming.
When does a failure need a root cause analysis?
Generally when the same failure recurs on the same asset, when a single event causes expensive downtime, when safety or the environment is involved, or when a component fails well before its normal life. A one-off failure of a cheap, non-critical component usually does not need a formal RCA.
How do you know an RCA has worked?
An RCA has worked when the data after the corrective actions shows the same failure has not returned over several of its previous failure intervals. A finished report or completed actions prove nothing on their own.
References
- [1]Andersen, B., & Fagerhaug, T. (2006). Root cause analysis: Simplified tools and techniques (2nd ed.). ASQ Quality Press.
- [2]Latino, R. J., Latino, K. C., & Latino, M. A. (2011). Root cause analysis: Improving performance for bottom-line results (4th ed.). CRC Press.
- [3]Moubray, J. (1997). Reliability-centered maintenance (2nd ed.). Industrial Press.
- [4]Ohno, T. (1988). Toyota production system: Beyond large-scale production. Productivity Press.
- [5]Ishikawa, K. (1986). Guide to quality control (2nd rev. ed.). Asian Productivity Organization.
- [6]International Electrotechnical Commission. (2006). IEC 61025:2006 Fault tree analysis (FTA). IEC.
- [7]International Electrotechnical Commission. (2018). IEC 60812:2018 Failure modes and effects analysis (FMEA and FMECA). IEC.
- [8]Card, A. J. (2017). The problem with '5 whys'. BMJ Quality & Safety, 26(8), 671-677.
- [9]International Organization for Standardization. (2016). ISO 14224:2016 Petroleum, petrochemical and natural gas industries: Collection and exchange of reliability and maintenance data for equipment. ISO.