
Asset reliability
Signs of a failing motor bearing and how to catch it before it seizes
The night shift technician reports that the transfer pump motor "sounds different". Two days later its drive end bearing seizes and scores the motor shaft on the way. That sound was not the first warning but one of the last, and this article covers the warnings that come earlier.
Key takeaways
- The best known signs of a failing motor bearing, a rough noise and a hot bearing housing, usually appear only once the damage is advanced.
- Bearings rarely fail from age alone. Wrong lubrication, contamination, misalignment, overload, electric current passing through the bearing, and poor mounting are causes found again and again.
- Early stage damage is easier to catch with high-frequency acceleration, envelope analysis, and ultrasound than with overall vibration velocity or temperature.
- Bearing defect frequencies such as BPFO and BPFI can be calculated from the bearing geometry and shaft speed, so a peak in the spectrum can be traced to the damaged part of the bearing.
What a bearing does in an industrial motor or pump
This article covers the signs of a failing motor bearing in the rolling bearings of industrial machines: electric motors, pumps, fans, blowers, and conveyor drives in a plant. Car and motorcycle wheel bearings work on the same principle, but the way they are checked and maintained is different, so they are not covered here.
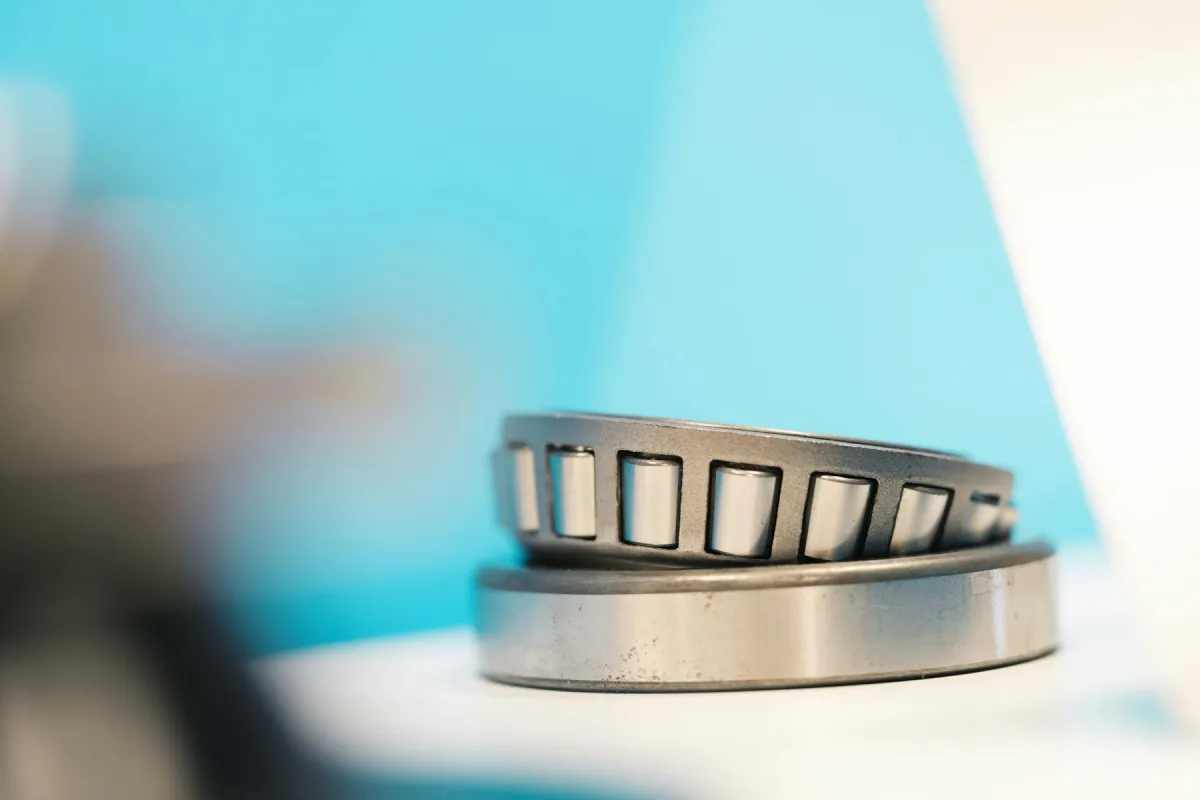
A rolling bearing supports a rotating shaft and carries its load, radial and axial, into the bearing housing. Friction stays low because the rolling elements, balls or rollers, roll between an inner ring mounted on the shaft and an outer ring seated in the housing. The cage keeps the rolling elements spaced apart, while the lubricant separates the metal surfaces with a very thin film[1]. An industrial electric motor usually has two bearings: one at the drive end (DE), next to the coupling or pulley, and one at the opposite side, the non-drive end (NDE).
A bearing that is correctly selected, correctly mounted, and well lubricated will still fail eventually through rolling contact fatigue: the stress repeated every time a rolling element passes finally starts microcracks in the raceway material. That fatigue life is very sensitive to load. For ball bearings, the basic life is inversely proportional to the cube of the equivalent load, so doubling the load cuts the basic life to about one eighth[1]. In practice, a good many bearings fail long before reaching that fatigue life, from other causes that could have been prevented.
Why do bearings fail? The most common causes
ISO 15243 groups rolling bearing damage into six main modes based on how it looks on a dismounted component, and links each mode to its likely causes[2]. The classification is useful because a damaged bearing keeps a record of what damaged it. The pattern of marks, the discoloration, and where the damage sits on the raceway often show whether the problem lies in lubrication, mounting, load, or electricity.
| Damage mode | Typical appearance | Likely causes |
|---|---|---|
| Fatigue | Spalling on the raceway, initiated below the surface or at the surface | Overload, fatigue life reached, lubricant film too thin, raceway dented by particles |
| Wear | Dull surfaces, internal clearance increased, smearing marks | Abrasive particles ingress, insufficient lubrication, rolling elements sliding |
| Corrosion | Rust, fretting corrosion on seats, false brinelling | Water or moisture ingress, vibration while the machine stands still, loose fits |
| Electrical erosion | Small craters on the raceway, a washboard pattern (fluting) | Electric current through the bearing, for example shaft currents in VFD driven motors or a misplaced welding ground |
| Plastic deformation | Dents on the raceway spaced at the rolling element pitch, or small dents from hard particles | Bearing hammered during mounting, shock load, hard particles overrolled |
| Cracking and fracture | Cracked or broken ring | Interference fit too tight, shock load, excessive heat |
Mode categories summarized from ISO 15243 [2]; the causes column lists common examples, not a complete list.
Lubrication is the cause most often named on the plant floor, and it can go wrong in both directions. Too little grease lets the lubricant film break down, so metal touches metal. Too much grease gets churned by the rolling elements, generates heat, and can be pushed out past the seal. Mixing two incompatible greases, or using a grease whose base oil viscosity does not suit the operating speed and temperature, also weakens that film.
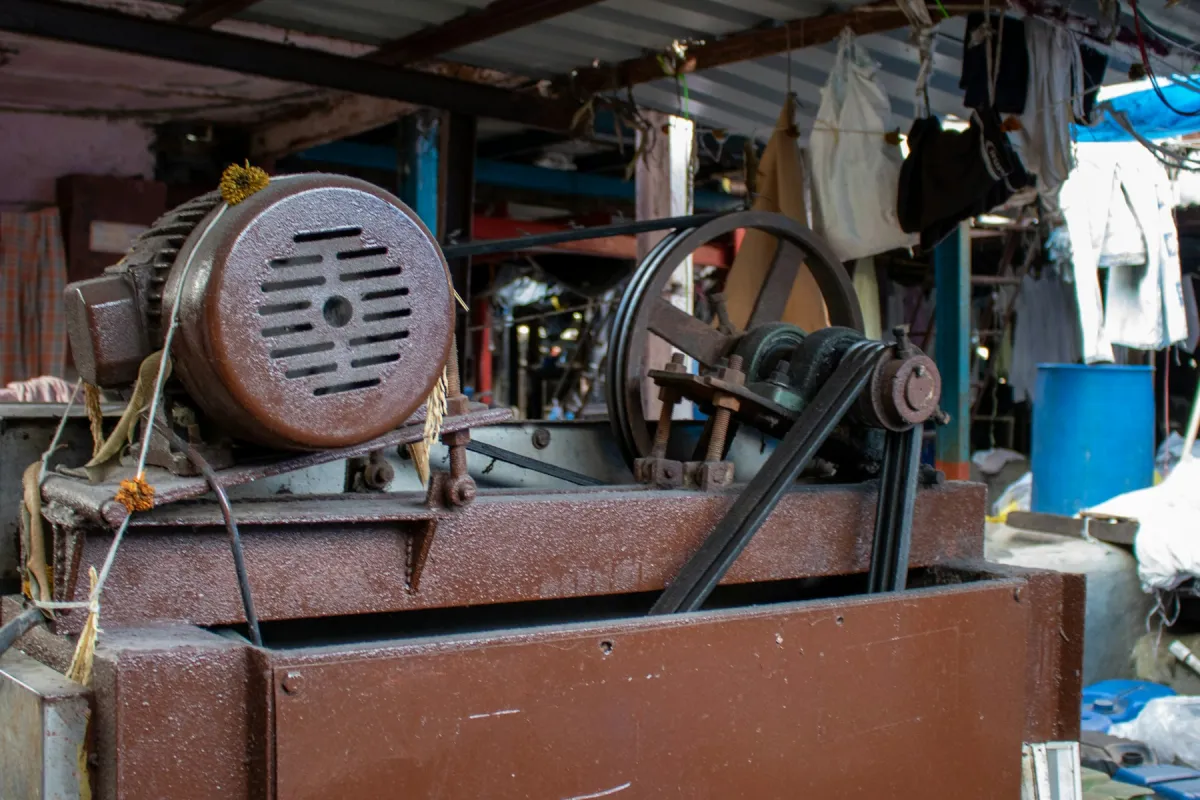
Contamination from dust, process powder, or water entering through a damaged seal scratches the raceways and speeds up wear. Misalignment between motor and pump, and unbalance in an impeller or fan, add a dynamic load to the bearing on every revolution. On a belt drive, a belt tensioned too tightly adds radial load to the motor DE bearing. All of this shortens fatigue life, in line with the sensitivity of life to load described above.
Two other causes are often missed. The first is electric current. In a motor controlled by a variable frequency drive (VFD), voltage can build up on the shaft and discharge through the bearing to the motor frame. Each discharge leaves a tiny crater, and over time the raceway develops a striped pattern that ISO 15243 classifies as electrical erosion[2]. The second is poor mounting: a bearing hammered on through the wrong ring passes the impact through the rolling elements and leaves dents in the raceway from the first day the bearing runs.
Signs of a failing motor bearing a technician can notice
There are five signs of a failing motor bearing that can be noticed without special instruments: a change in sound, a hotter bearing housing, vibration that feels stronger, grease that leaks or changes color, and motor current that rises with no change in process load. All of them are useful, but they do not appear at the same time. Most can only be sensed by a person once the damage has progressed quite far.
| Symptom | Likely cause | How to check |
|---|---|---|
| Rough humming, rattling, or squealing from the bearing housing | Advanced defect on a raceway or rolling element; insufficient lubrication (squealing) | Mechanical stethoscope or ultrasound instrument on the bearing housing; compare DE with NDE and with a similar motor |
| Bearing housing hotter than usual | Insufficient or excess grease, overload, misalignment, internal clearance too small | Infrared thermometer or contact probe at the same spot; compare with earlier records and a similar motor at similar load |
| Vibration rising | Bearing damage, unbalance, misalignment, mechanical looseness | Overall RMS velocity and acceleration or envelope on the bearing housing, in the horizontal, vertical, and axial directions |
| Grease leaking, blackened, or containing metal debris | Excess grease, damaged seal, overheating, internal wear | Check the seals and grease drain port; look at the color and texture of the purged grease |
| Motor current rising with no change in process load | Increased friction, misalignment, higher mechanical load | Clamp meter on all three phases under the same load; compare with history |
| Shaft feels rough or loose when turned by hand | Advanced damage, increased clearance, contamination | After the energy is isolated and locked out (LOTO), turn the shaft slowly and feel for roughness and radial play |
The order in which the symptoms appear is what is often misunderstood. Noise the ear can hear, heat the hand can feel, and rising motor current are usually late stage symptoms. By then the raceway surface has typically spalled over a fair area. Motor current in particular is a weak indicator for bearings, because the added friction in the bearing of a medium-sized motor changes the current only slightly compared with swings in process load. Symptoms that appear earlier are generally caught only by instruments, as the next sections explain.
Stages of bearing failure and why hearing it means late
Fatigue damage does not happen in a day. In the classical theory, microcracks start slightly below the raceway surface, where the shear stress from rolling contact is highest, and then propagate to the surface until a small piece of material breaks away[1]. The path from the first crack to a seized bearing can be described in a few stages. The boundaries between stages are not sharp, and the length of each stage varies widely.
- Early stage. Cracks below the surface, or a lubricant film that is starting to become inadequate. No visible defect yet. Changes show only in very high-frequency signals, such as ultrasound or acceleration in the kHz range.
- Small surface defect. A crack reaches the surface and forms a small pit. Every time a rolling element passes over it, a short impact repeats at the bearing defect frequency. These impacts excite structural resonances at high frequency and are read most clearly with envelope analysis[3].
- Defect spreading. The spalled area grows. The defect frequencies and their harmonics begin to show in the velocity spectrum, and temperature may start to rise.
- Final stage. The surface is badly damaged, internal clearance grows, vibration rises across a wide frequency range, the noise is clearly audible, and the housing feels hot. The next step is a broken cage or a seized bearing.
The time between point P and point F is called the P-F interval, the time available to plan and carry out a replacement. The concept is covered in more detail in the article on predictive maintenance. The implication for bearings is clear: a technique that catches the early stage gives the longest planning time, while waiting for noise means starting to plan once most of that interval is already gone.
How to tell if a motor bearing is failing by measurement
Each measurement method sees a different stage of damage. A good program usually combines more than one method and reads all of them as trends against the normal condition of that machine, the same principle that underpins condition monitoring.
Overall vibration velocity
For general evaluation on a bearing housing, ISO 20816-1 commonly uses RMS vibration velocity in mm/s measured over a broad frequency range[4]. This value is very good at catching unbalance, misalignment, and looseness, which are frequent causes of bearing damage. For the bearing itself, however, overall velocity is a late indicator. The small impacts from an early defect carry little energy at low and medium frequencies, so they are buried among the machine’s other vibration. The basics of these measurement quantities are covered in the article on machine vibration analysis.
High-frequency acceleration and envelope analysis
The impacts from a bearing defect are very brief and excite resonances at high frequency, often in the kilohertz range. Envelope analysis (demodulation) makes use of this. The acceleration signal is filtered in the high-frequency band where that resonance sits, and then its envelope is taken, the line that follows the peaks of the impacts. The spectrum of that envelope no longer shows the resonance frequency but how often the impacts repeat[5]. Randall and Antoni describe envelope analysis as the benchmark method for rolling bearing diagnostics[3].
Bearing defect frequencies: BPFO, BPFI, BSF, and FTF
The repetition frequency of those impacts can be calculated from the bearing geometry and the shaft speed. There are four common frequencies: BPFO (ball pass frequency, outer race) for a defect on the outer raceway, BPFI (ball pass frequency, inner race) for the inner raceway, BSF (ball spin frequency) for a rolling element, and FTF (fundamental train frequency) for the rotation of the cage[3].
Outer race defect frequency (BPFO)
BPFO = (n/2) × f_r × (1 − (d/D) cos φ)
n = number of rolling elements (balls or rollers).
f_r = shaft rotation frequency in Hz (r/min ÷ 60), with the outer ring stationary.
d = rolling element diameter; D = pitch diameter, the diameter of the circle through the centers of the rolling elements.
φ = contact angle; for a deep groove ball bearing under pure radial load, φ = 0°, so cos φ = 1.
The other three formulas take a similar form: BPFI = (n/2) × f_r × (1 + (d/D) cos φ), FTF = (f_r/2) × (1 − (d/D) cos φ), and BSF = (D/2d) × f_r × (1 − ((d/D) cos φ)²)[3]. The pattern in the envelope spectrum also helps locate the defect. An outer race defect, stationary relative to the load zone, tends to show as BPFO with its harmonics. An inner race defect rotates in and out of the load zone, so BPFI is often accompanied by sidebands spaced at 1× shaft speed. A ball defect can strike both races in one revolution of the ball, so what appears is often twice BSF, with sidebands at FTF[3].
Two important notes. First, these formulas assume the rolling elements roll without sliding. In reality there is always some slip, so the measured frequency typically differs from the calculated one by about one to two percent[3]. Second, the exact geometry is best taken from the bearing manufacturer’s catalog, or the defect frequencies taken directly from the catalog tables, based on the type number of the bearing actually installed.
Temperature trend and ultrasound
Bearing housing temperature is easy to measure and useful for catching lubrication problems, overload, and clearance that is too small[6]. Its weakness is that with ordinary fatigue damage, temperature generally rises only at a late stage, and the reading is affected by ambient temperature and load. Temperature is therefore most meaningful as a trend under comparable operating conditions, or as the difference from a similar motor next to it.
Ultrasound listens to sound waves above the range of human hearing, produced by friction and micro impacts[6]. Handheld ultrasound instruments are widely used to check bearings at an early stage and to guide relubrication: the technician adds grease a little at a time while listening, and stops when the sound level no longer drops. As with other methods, the result means most when compared with earlier readings at the same point.
Worked example: BPFO on a pump motor
The numbers below are illustrative; this bearing geometry does not represent any particular type number. A four-pole motor drives a pump at 1,485 r/min. Its DE bearing is a deep groove ball bearing with 9 balls, ball diameter d = 10 mm, pitch diameter D = 50 mm, and contact angle φ = 0°.
The shaft rotation frequency is f_r = 1,485 ÷ 60 = 24.75 Hz. The ratio d/D = 10 ÷ 50 = 0.2, and since cos 0° = 1, the factors are (1 − 0.2) = 0.8 and (1 + 0.2) = 1.2. The results:
- BPFO = (9/2) × 24.75 × 0.8 = 4.5 × 24.75 × 0.8 = 89.1 Hz, or 3.6 times the rotation frequency.
- BPFI = 4.5 × 24.75 × 1.2 = 133.65 Hz, or 5.4 times the rotation frequency.
- FTF = (24.75/2) × 0.8 = 12.375 × 0.8 = 9.9 Hz.
- BSF = (50/20) × 24.75 × (1 − 0.04) = 2.5 × 24.75 × 0.96 = 59.4 Hz.
There is a quick check that the arithmetic is right: BPFO plus BPFI always equals n × f_r. Here 89.1 + 133.65 = 222.75 Hz, the same as 9 × 24.75 = 222.75 Hz. If the envelope spectrum of the DE bearing shows a peak at around 87 to 91 Hz, with harmonics near 178.2 Hz and 267.3 Hz, the pattern is consistent with an outer race defect. If the peak sits near 133.65 Hz with sidebands at 108.9 Hz and 158.4 Hz (24.75 Hz apart), the pattern is more consistent with an inner race defect. A conclusion like this still needs confirming with the trend, measurements at other points, or inspection of the bearing once removed.
Steps to check a motor bearing on the floor
The steps below can be used for a routine check or when someone reports a motor that "sounds different". ISO 13373-1 gives general procedures for vibration condition monitoring, including choosing measurement points on bearing housings and the importance of consistent operating conditions[7]. Put safety first: measurements on a running motor are taken without touching any rotating part, and checks that require turning the shaft by hand are done only after the energy has been isolated and locked out.
- Know the machine. Record the speed, power, coupling or belt type, and the DE and NDE bearing type numbers from the nameplate or motor documentation. Without this data the defect frequencies cannot be calculated.
- Listen with an instrument. Use a mechanical stethoscope or an ultrasound instrument on the bearing housing. Compare DE with NDE, and compare with a similar motor known to be healthy.
- Measure the bearing housing temperature at the same spot every time, and record the ambient temperature and machine load as well.
- Measure vibration on both bearing housings in the horizontal, vertical, and axial directions. Take overall RMS velocity for the general trend, and acceleration or envelope for early signs of bearing damage.
- Measure the current on all three phases with a clamp meter under the same load as the previous measurement, and compare with history and the rated current.
- Check the grease and seals. Look for leaks, blackened grease or grease containing debris, and the relubrication records: grease type, quantity, and interval.
- Check the surrounding causes: coupling or pulley alignment, belt tension, loose base bolts, an uneven motor foot (soft foot), and on VFD driven motors, grounding and signs of shaft current.
- Compare with the baseline and decide. A normal condition is simply recorded; a doubtful change is monitored more closely; confirmed damage has its replacement scheduled through a work order in the CMMS.
After the damage is detected
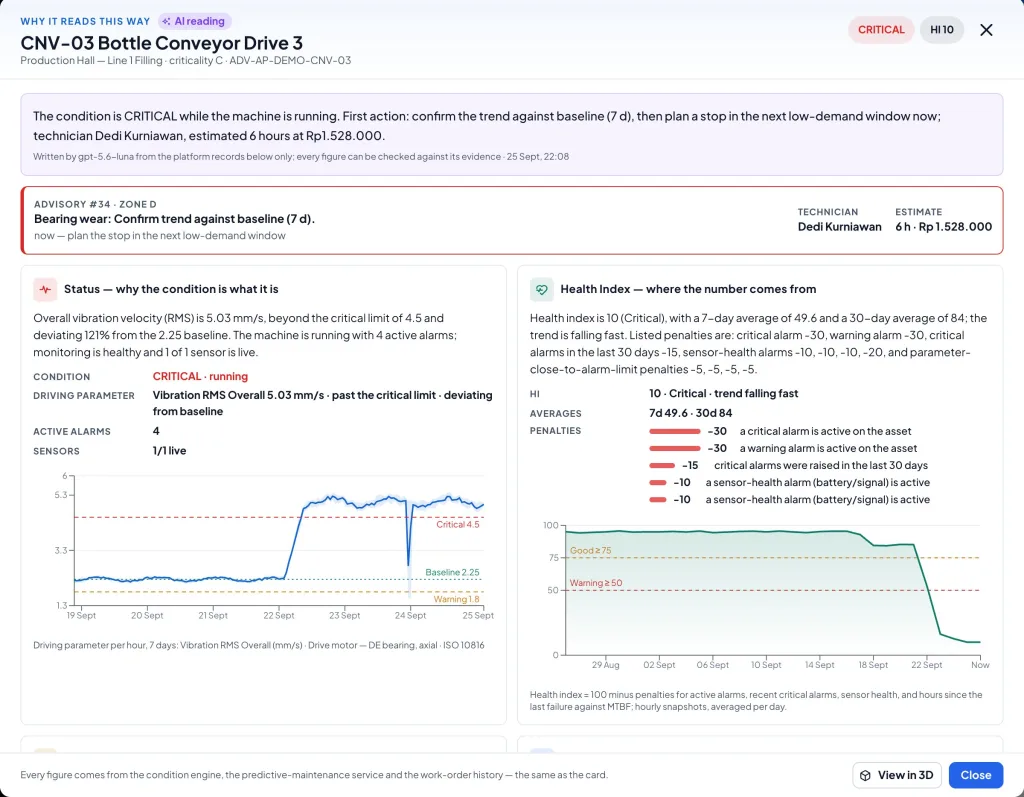
Finding bearing damage rarely means the machine has to stop that very moment. What matters more is judging how fast the condition is getting worse. Confirm with a second method, shorten the measurement interval, and watch the slope of the trend. A slowly rising trend leaves room to schedule the replacement in the next production break; a trend that jumps, or symptoms that are already audible and hot, call for an earlier stop.
Prepare the replacement fully: a replacement bearing with the same type number, clearance class, and seal type as specified, the right grease, and the right mounting tools. Mount the bearing with an induction heater or a press tool that applies force through the ring with the interference fit, never through the rolling elements, and never strike it directly with a hammer. Once the motor is back in place, check shaft alignment and take new vibration and temperature readings as the baseline.
Do not throw away the removed bearing before it has been inspected. Clean it, section it if needed, and match its damage pattern to the modes in ISO 15243[2]. A washboard pattern on the raceway points to electric current, evenly spaced dents point to the mounting method, and a skewed load path points to misalignment. Tracing the cause with root cause analysis is how the new bearing is kept from the same fate.
Common mistakes and limits
- Waiting for noise. Noise and heat are late stage signs. Relying on them means most of the planning time is already gone.
- Adding grease every time a bearing gets noisy. The noise may subside for a while, but the damage remains, and excess grease adds heat.
- Replacing the bearing without finding the cause. If the cause is misalignment, shaft current, or contamination, the new bearing will fail with the same pattern.
- Looking only at overall velocity. Early bearing defects often do not move this value yet. Acceleration, envelope, or ultrasound is needed to catch them earlier.
- Comparing data that is not comparable. The measurement point moves, directions get swapped, or machine load differs, and the difference is read as damage.
- Assuming one method catches every fault. Damage that develops quickly can occur between two measurements, and every method has blind spots. No method guarantees that every bearing failure is detected before it happens.
Conclusion
The best known signs of a failing motor bearing, noise, heat, and rising current, almost always come late. Bearing damage develops in stages from a small crack below the surface to widespread spalling, and its early stages are caught only by measurement: high-frequency acceleration and envelope analysis, ultrasound, and defect frequencies such as BPFO and BPFI that can be calculated from the bearing geometry.
A useful check does not have to be complicated. Know the bearing that is installed, measure at the same point in the same way, compare with the baseline, and follow up every finding with a planned replacement and a search for the cause. Bearings rarely fail without a reason, and a removed bearing usually shows that reason to anyone willing to look at it.
Frequently asked questions
What are the signs of a failing motor bearing?
Common signs are rough, rattling, or squealing noise from the bearing housing, a housing hotter than usual, rising vibration, grease that leaks or turns black, and motor current that rises with no change in load. Most of these signs appear only once the damage is advanced.
How can you tell a motor bearing is failing before it seizes?
Measure vibration on the bearing housing regularly, especially high-frequency acceleration and envelope analysis, add ultrasound and temperature trends, and compare the results with the motor’s own baseline. Defect frequencies such as BPFO and BPFI help show which part of the bearing is damaged.
What causes bearings to fail?
Besides material fatigue once the service life is reached, bearings often fail from too little, too much, or the wrong grease, dust and water contamination, misalignment, unbalance, excessive load or belt tension, electric current passing through the bearing in VFD driven motors, and poor mounting.
Can a noisy bearing still be used?
There is no fixed time limit. Audible noise generally indicates advanced damage, so the replacement should be scheduled promptly and the condition monitored more closely until the bearing is replaced.
What is BPFO in a bearing?
BPFO (ball pass frequency, outer race) is the frequency of the impacts that occur when rolling elements pass over a defect on the outer raceway. It is calculated from the number of rolling elements, the element diameter, the pitch diameter, the contact angle, and the shaft speed.
References
- [1]Harris, T. A., & Kotzalas, M. N. (2007). Rolling bearing analysis (5th ed.). CRC Press.
- [2]International Organization for Standardization. (2017). ISO 15243:2017 Rolling bearings: Damage and failures, Terms, characteristics and causes. ISO.
- [3]Randall, R. B., & Antoni, J. (2011). Rolling element bearing diagnostics: A tutorial. Mechanical Systems and Signal Processing, 25(2), 485-520.
- [4]International Organization for Standardization. (2016). ISO 20816-1:2016 Mechanical vibration: Measurement and evaluation of machine vibration, Part 1: General guidelines. ISO.
- [5]Randall, R. B. (2011). Vibration-based condition monitoring: Industrial, aerospace and automotive applications. Wiley.
- [6]Mobley, R. K. (2002). An introduction to predictive maintenance (2nd ed.). Butterworth-Heinemann.
- [7]International Organization for Standardization. (2002). ISO 13373-1:2002 Condition monitoring and diagnostics of machines: Vibration condition monitoring, Part 1: General procedures. ISO.